
Have you been searching for a cost-effective way to enhance research visuals? Photopea is the answer. Read our Photopea review and get started today.
Visual representation is a powerful tool in academic research, enabling researchers to distill complex ideas into easily understandable formats. However, creating compelling, clear, and professional-looking visuals can be a daunting task, especially if you have limited graphic design experience.
One platform, however, that succeeds in striking this balance is Photopea. In this blog post, we’ll discuss Photopea’s relevance to research work and provide a detailed walkthrough on how to use this fantastic free tool to transform your research visuals.
Table of Contents
I. What is Photopea?
Photopea is an online image editing tool that resembles popular platforms such as Adobe Photoshop. It’s a web-based application, which means that you can access it from any device with an internet connection.
The tool comes packed with features and functionalities you’d expect from a high-quality image editor. These include layers, history, brush tools, smart objects, text tools, and more.
It’s also compatible with a range of file formats such as .PSD, .AI, .XCF, .Sketch, and .XD. This allows for easy integration with your existing design workflow.
While many image editors are available, Photopea stands out for its combination of professional-grade tools and user-friendly interface. Plus, being free makes it even more appealing, especially for students or researchers on a budget.
II. What Are the Benefits of Using Photopea for Research?
The world of research often involves the production and presentation of complex data. Visualizing this data in an understandable and appealing way can be a daunting task, but that’s where Photopea comes in. Let’s explore the benefits of using Photopea for research.
#1. Intuitive Interface
Even if you’re a novice in the world of graphic design, Photopea is built to be user-friendly. The tool offers a simple, intuitive interface that is easy to navigate, lowering the learning curve considerably and allowing you to quickly grasp its functionalities.
#2. Advanced Features
Despite its simplicity and zero-cost model, Photopea boasts of several advanced features that can help in creating stunning visuals for research. These include layers, masks, smart objects, and a host of filters and effects.
#3. Scalable Image Editing
Photopea allows for vector editing, which means you can create and edit photos that can be scaled up or down without loss of quality. This is particularly useful when preparing visuals for research, as you may need to present your images in various formats and sizes.
Here is our review of the best tools for drawing molecular diagrams. You can use any of this tools to create quality scientific diagrams.
#4. Training Resources
If you’re unsure how to navigate Photopea, the tool provides a host of tutorials and guides. You can leverage these resources to learn how to make the most out of this powerful image editing tool for your research visuals.
#5. Respecting Privacy
Unlike some tools, Photopea doesn’t require any personal data or account setup. The tool respects your privacy and allows you to get on with creating high-quality research visuals with no strings attached.
Photopea offers a comprehensive, cost-effective, and user-friendly solution for transforming complex data into clear, visually engaging research graphics.
Whether you’re a newbie or a seasoned researcher, Photopea provides you with the tools and features to bring your research visuals to life, thus enhancing your presentations, publications, and overall research impact.
III. What Is My Personal Journey with Photopea?
As an academic, I often find myself having to translate complex data into compelling visuals. On one such occasion, I decided to put Photopea to the test, aiming to create an intuitive bar graph. What unfolded was a mix of challenges and rewarding successes that cemented Photopea as a mainstay in my visual toolkit.
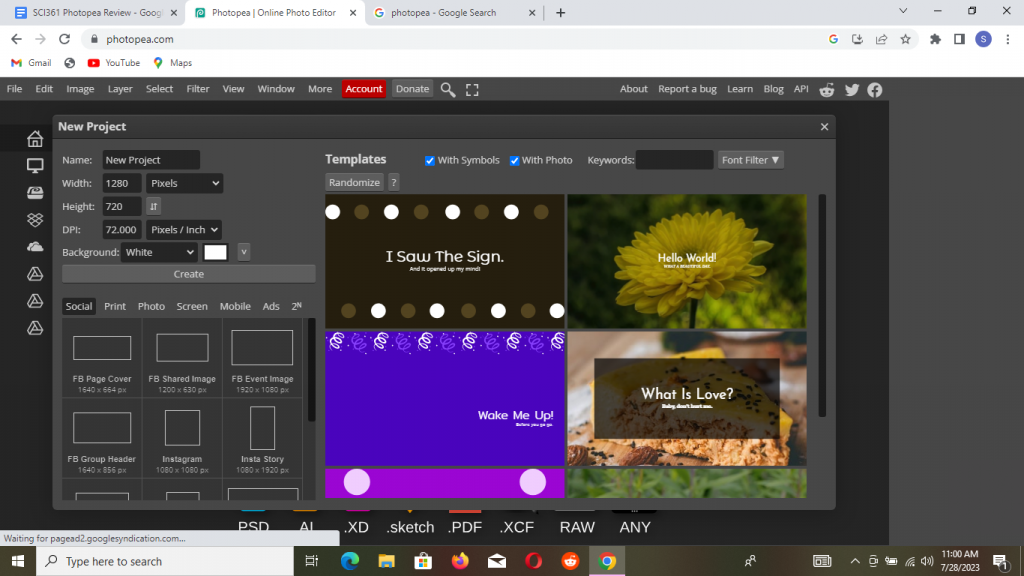
a. Embracing the Ease of Templates and Plugins
One of the highlights of my Photopea experience was undoubtedly the availability of ready-to-use templates. This feature helped to kickstart my design process, allowing me to focus more on the content than the structural design.
I also appreciated the variety of additional plugins that Photopea offers. These ranged from different font styles to unique visual effects, which greatly increased my options and enhanced the aesthetic appeal of my bar graph.
b. Navigating the Challenges
Despite the overall positive experience, I did encounter a few challenges along the way. Photopea, while impressive in its capabilities, did lack some of the advanced features that professional software offers. However, it’s important to remember that Photopea is a free tool.
When compared to its premium counterparts, it does remarkably well. I found that even though there were some advanced features missing, I could still create a high-quality, professional-looking bar graph with the tools at my disposal.
c. My Verdict
While Photopea may have its limitations, just like these visualization tools, it provides a wealth of features that are more than sufficient for most academic visualization tasks. The availability of templates and plugins can greatly speed up the design process and add a layer of polish to your work.
Yes, there might be a slight learning curve, and yes, it might not have every feature that a premium software offers, but the end result is definitely worth the effort. For anyone in academia looking for a cost-effective way to create professional-looking visuals, I highly recommend giving Photopea a try.
IV. How Can You Use Photopea for Your Research?
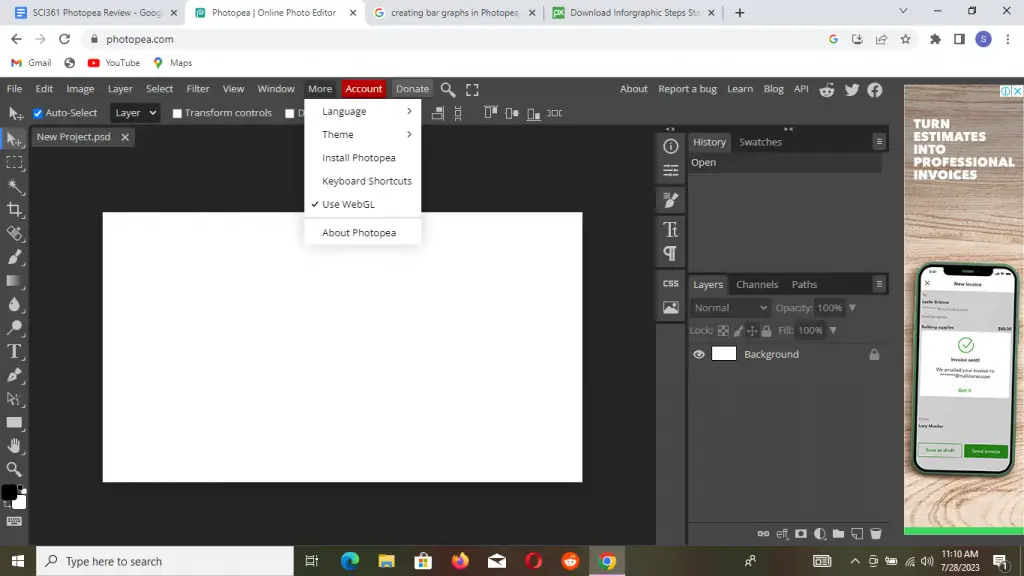
To get you started with Photopea, i’ll walk you through the process of setting up and navigating the tool, as well as demonstrate how to use some of its basic and advanced features.
Step 1: Accessing and Setting Up Photopea
Begin by launching your web browser of choice, be it Chrome, Safari, Firefox, or others. Enter the Photopea website URL in the search bar to access the tool.
This powerful online editing tool, conveniently available on the cloud, means no downloads or installations are needed, saving you valuable storage space on your device.
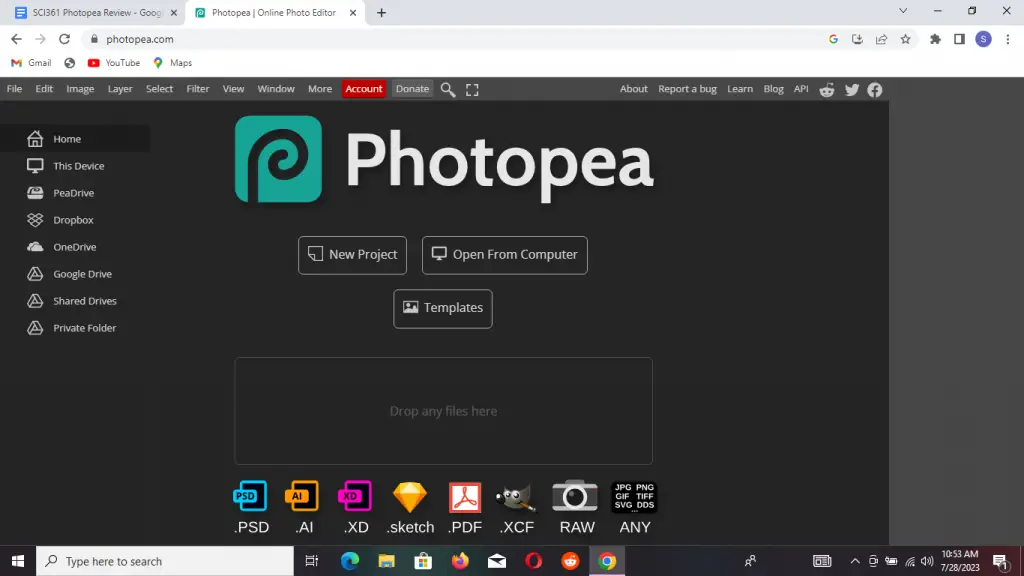
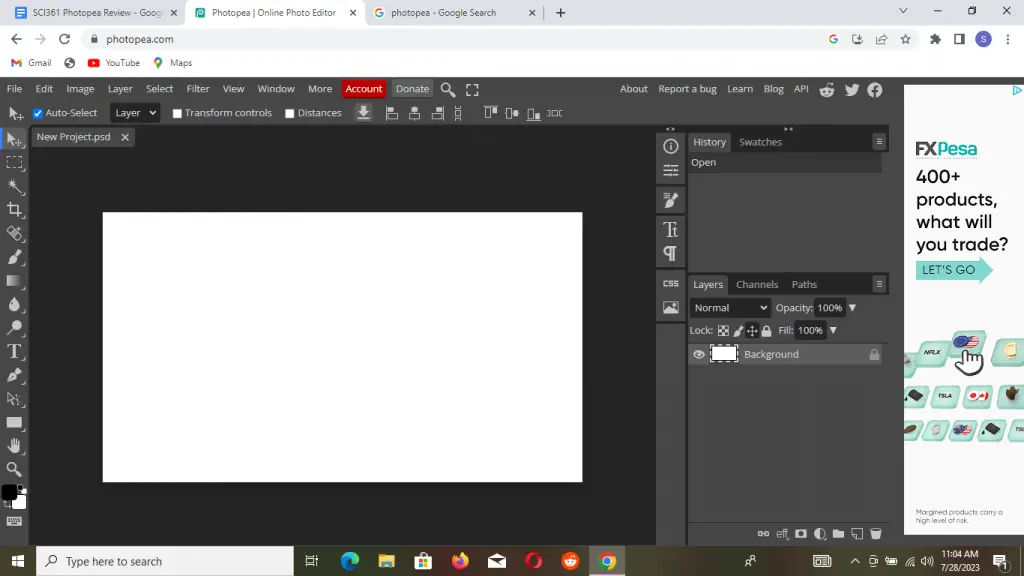
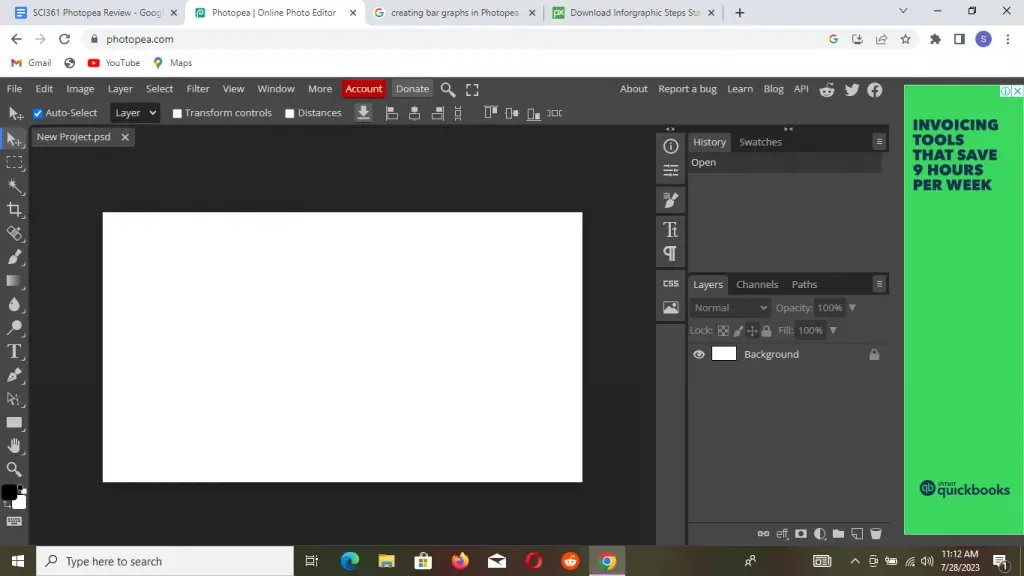
You’ll be greeted by a clean, user-friendly interface. If you want to access additional features such as online saving, click ‘File’ on the top menu bar and select ‘Sign In.’ You can register for a free account using your email address or sign in via Google.
Step 2: Importing an Image
If you’re starting with an existing image, importing it into Photopea is a breeze. Navigate to the ‘File’ menu, select ‘Open’, and locate your image. Alternatively, you can use the intuitive drag-and-drop function to add your image into the Photopea workspace.
Step 3: Using Layers
Understanding layers is fundamental for creating intricate designs. In the ‘Layer’ tab, select ‘New’ to create a new layer for your bar graph. This function allows you to work on different elements of your graphic independently, minimizing the risk of accidental alterations.
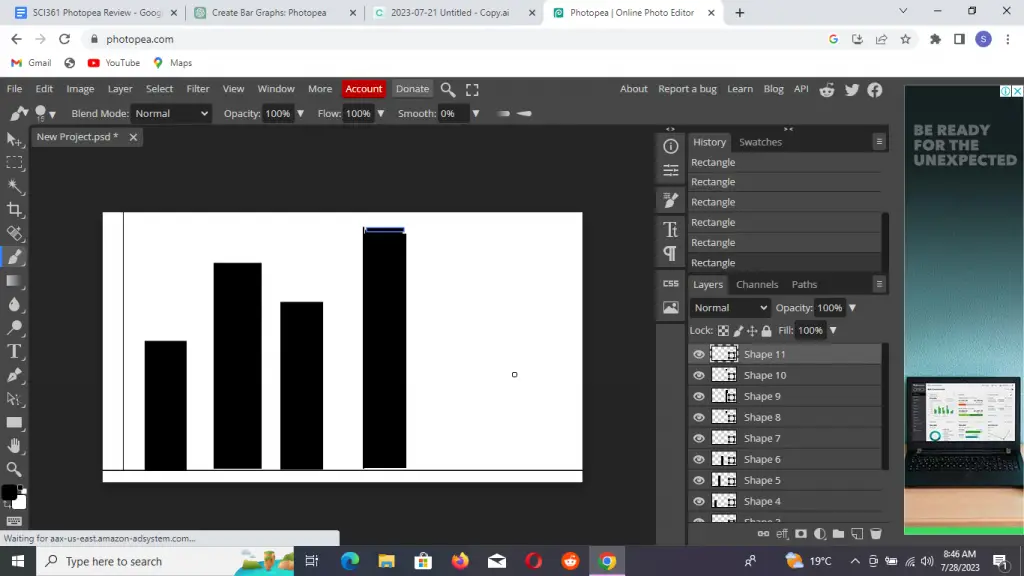
Step 4: Creating the Bar Graph
The creation of your bar graph begins with the ‘Rectangle’ tool, found in the toolbar on the left. Use your mouse to click, hold, and drag to form a rectangle shape that will represent the first bar of your graph.
Duplicating this rectangle is straightforward. Press Ctrl+J (or Command+J on a Mac), which automatically creates a copy of the selected rectangle. Using the ‘Move’ tool, position your new bar adjacent to the original one. Repeat this process until you have enough bars to represent your data.
Each bar can represent different values. To reflect this, select a specific bar and use the ‘Transform’ controls to resize it. You can adjust the height to mirror the data value that the bar represents, creating an accurate, visually-pleasing graph.
Step 5: Adding and Manipulating Text
Labels and titles enhance the clarity of your graph. Select the ‘Text’ tool (the ‘T’ icon) from the toolbar and click on your canvas where you’d like your text. This could be data labels for your bars or a descriptive title for your graph.
Personalizing your text is simple. With the text selected, you have a range of formatting options in the top menu bar. Adjust the font style, size, and color to suit your preference. Don’t forget to consider readability, especially when selecting fonts and colors.
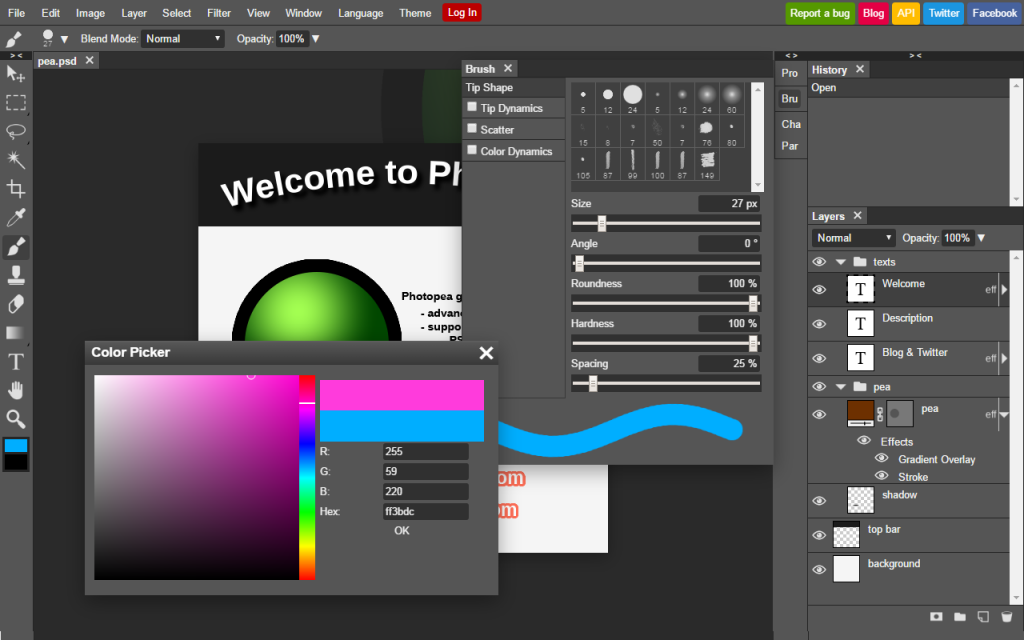
Step 6: Adjusting Color, Brightness, and Contrast
With your graph created, you may wish to tweak its appearance for better clarity or visual appeal. Select the layer you want to adjust and go to ‘Image’ > ‘Adjustments’.
Here you’ll find options for adjusting brightness, contrast, hue, saturation, and more. These adjustments can be critical in ensuring your graph is as clear and impactful as possible.
Step 7: Saving and Exporting Your Work
Finally, once you’re satisfied with your graph, you can save it. Click on ‘File’ > ‘Export As’ and choose your preferred format. Photopea supports a wide range of formats, including PNG, JPEG, SVG, and even PSD files for Photoshop compatibility.
You’ve now transformed your data into a professional-quality visual ready for incorporation into your research paper.
V. What Are the Real-life Examples of Using Photopea for Research Visuals?
Using Photopea for research visuals can be incredibly diverse. Here are some practical ways researchers can use this photo editing software:
#1. Sprucing up Graphs and Charts
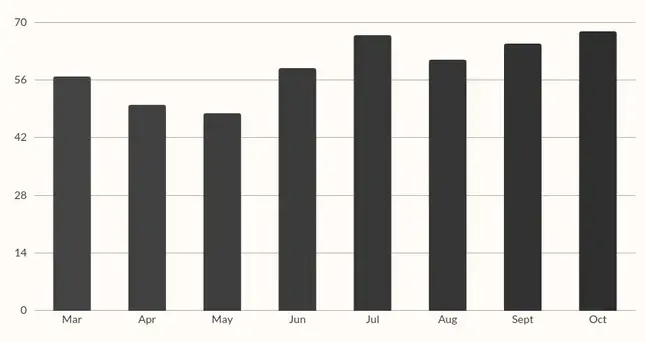
Graphs and charts are integral to data presentation in academia. However, let’s face it, default designs from data analysis tools like Excel or SPSS often fall short in aesthetic appeal.
Photopea comes to the rescue by allowing you to import these graphs and charts and tweak them to your liking. You can add labels, make color adjustments, or even introduce annotations, all aimed at enhancing visual appeal and comprehension.
#2. Perfecting Scientific Imagery

Working with scientific images is a common occurrence in research, be it annotating microscopic observations or adjusting the brightness and contrast of fieldwork photographs.
Photopea boasts a variety of versatile tools that make these tasks a breeze. With it, you can manipulate images to suit your requirements and enhance the overall clarity of your findings.
#3. Crafting Infographics from Data
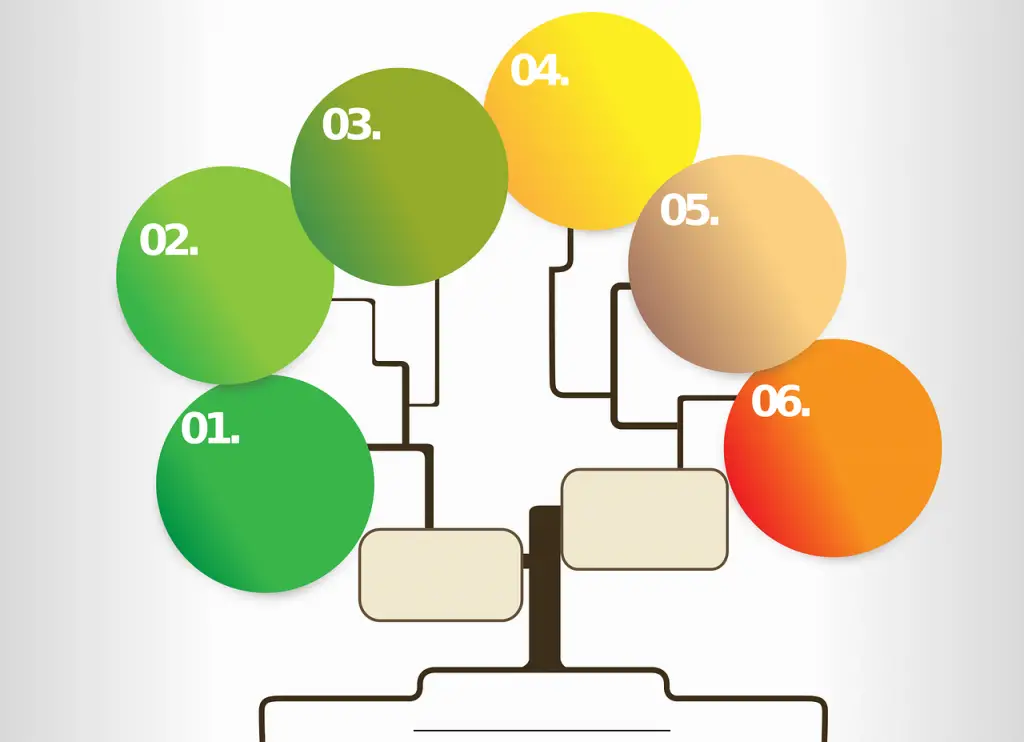
When it comes to making research findings more digestible and accessible to a broader audience, infographics are the way to go. However, creating one might seem like a daunting task if you lack specialized design software. Fear not, Photopea is here.
With its user-friendly interface, you can easily construct infographics by adding text, inserting shapes and icons, or incorporating images. The use of layers in Photopea allows you to effortlessly organize these different elements, enabling you to transform your research data into a visually engaging infographic.
#4. Designing Interactive Diagrams
One underrated aspect of research is the use of diagrams to explain concepts, processes, or relationships within your study. With Photopea, you can go beyond the rudimentary diagrams by designing interactive and vibrant illustrations.
Add various shapes, arrows, text, and more to clearly showcase your ideas and help your audience grasp the nuances of your research.
#5. Constructing Posters for Conferences
At academic conferences, posters are a popular method of presenting research. A well-designed poster can engage your audience, facilitate discussions, and showcase your findings effectively.
Photopea provides all the tools you need to design striking, well-organized, and information-rich posters. Whether you’re starting from scratch or using a template, you can easily adjust layouts, color schemes, text styles, and add high-quality images to create a compelling poster.
#6. Developing Research Themed Social Media Content
Sharing research findings on social media platforms is becoming more prevalent. Photopea can be instrumental in creating engaging social media posts that highlight key aspects of your research.
From designing eye-catching thumbnails for your research vlogs to crafting Instagram posts that summarize your latest findings, Photopea makes it easy to share your research with the online world.
VI. What Are the Tips and Tricks for Getting the Most out of Photopea?
The tips below will help you make the most out of this online tool.
a. Harness the Power of Keyboard Shortcuts
If you’re looking to speed up your Photopea experience and streamline your workflow, keyboard shortcuts are your new best friend. Akin to most image editing platforms, Photopea supports a variety of shortcuts that can significantly enhance your efficiency.
For instance, pressing ‘V’ switches to the move tool, ‘B’ calls upon the brush tool, and ‘E’ activates the eraser. With a plethora of other keyboard shortcuts at your disposal, it’s worthwhile to invest some time learning them for a smoother editing journey.
b. Tailor Your Workspace for Optimum Convenience
Photopea boasts a highly customizable workspace designed to cater to your unique needs. Its user-friendly interface allows you to maneuver panels, group them together, or completely hide them based on your preference.
Whether you prefer a minimal workspace or want all the tools and panels at a glance, Photopea gives you complete control over your design environment.
c. Leverage the History Function to Rectify or Revert Changes
In the creative process of editing visuals, errors or second thoughts are inevitable. Photopea’s History panel is here to the rescue. This convenient feature records your recent actions, providing you with the ability to return to any previous state of your project.
d. Tap into Photopea’s Rich Learning Resources
To truly unlock Photopea’s full potential, it’s essential to familiarize yourself with its wide array of features and tools. Luckily, Photopea offers an extensive range of online tutorials and resources aimed at empowering users to master the platform.
From basic introductions to advanced techniques, these guides provide a wealth of knowledge that can elevate your Photopea prowess, and consequently, your research visuals.
Here is one of the Photopea tutorials: https://www.youtube.com/watch?v=a3aPaTNV5g4
e. Experiment with Photopea’s Advanced Features
Beyond the basic tools, Photopea is packed with advanced features that can help transform your visuals into professional-quality graphics. With capabilities ranging from layer masks and blending modes to gradient maps and advanced filters, the possibilities are practically endless.
Don’t be afraid to experiment and push the boundaries of your designs. These advanced features, once mastered, can add depth and sophistication to your research visuals.
f. Optimize Image Quality with Photopea’s Export Options
Another area where Photopea shines is its export options. After pouring effort into creating an impactful visual, it’s critical to ensure the final image maintains its quality. Photopea supports multiple file formats including PNG, JPG, SVG, and even PSD.
Depending on your project requirements, you can choose the optimal format to preserve image quality. Additionally, Photopea lets you tweak image resolution and compression settings to strike the perfect balance between quality and file size.
g. Take Advantage of Photopea’s Vector Editing Capabilities
Photopea isn’t just for raster graphics; it’s equally adept at handling vector and raster graphics, making it a versatile tool for your research visual needs.
Its vector editing capabilities allow you to create sharp, scalable graphics, from simple line art to complex diagrams. If you need to create graphs or infographics where precision matters, Photopea’s vector tools will be indispensable.
VII. What Are the Best Photopea Alternatives for Research Visuals?
While Photopea is a great tool, it’s not the only one out there. Here are some alternatives:
#1. Adobe Photoshop
Adobe Photoshop is the gold standard when it comes to image editing and graphic design. Its range of tools and features are extensive and highly customizable, offering unparalleled capabilities for those who are proficient in using it.
However, this very popular online tool has two main drawbacks: the steep learning curve for beginners and the high subscription cost. If your work requires sophisticated graphics regularly, investing time and money into Photoshop might be worthwhile.
#2. GIMP (GNU Image Manipulation Program)
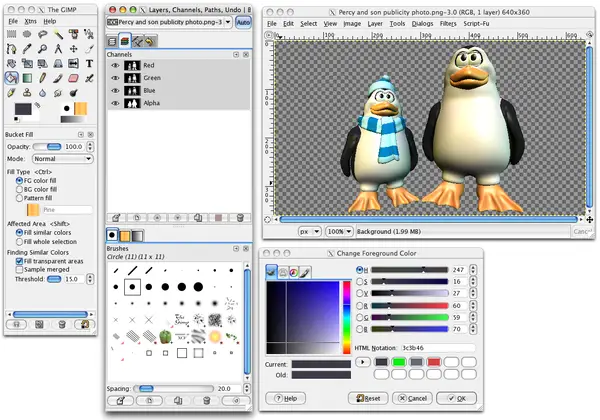
GIMP is one of the free Photoshop alternatives. It provides a comprehensive set of tools for image editing, such as layers, filters, and effects.
Although GIMP also has a relatively steep learning curve, it doesn’t have the associated costs and is a good option for those looking for a robust, no-cost solution.
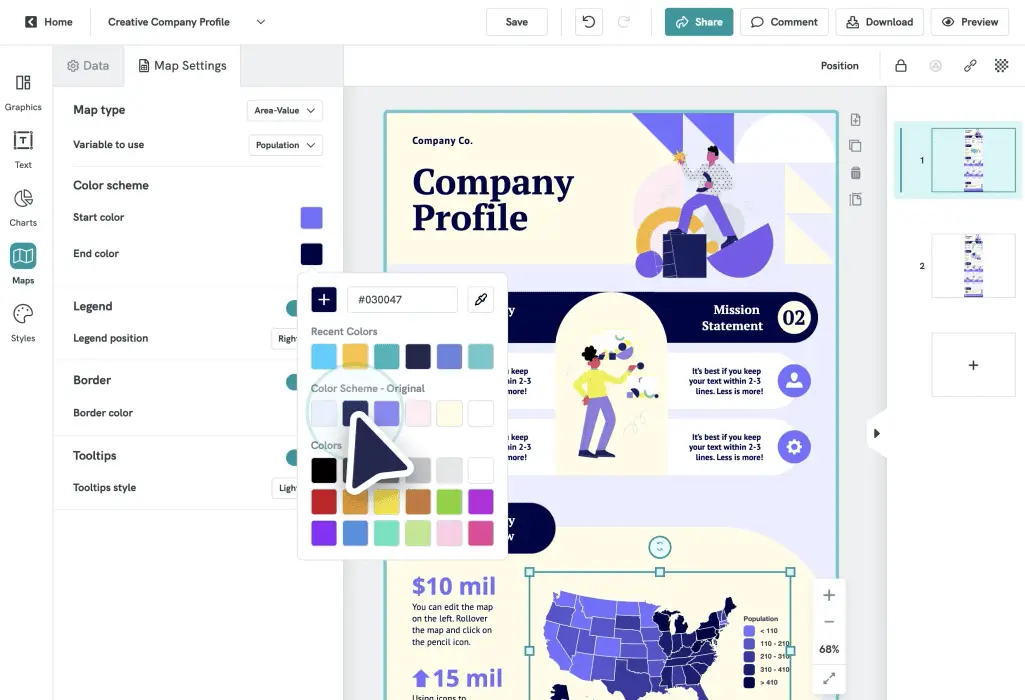
#3. Canva

Canva is an online tool that allows you to create a variety of designs, including infographics, presentations, and social media posts. Its easy-to-use interface and extensive collection of templates make it a favorite among beginners and those who are less technically inclined.
While it has a free version, some advanced features and premium templates require a paid subscription.
#4. Microsoft Paint 3D
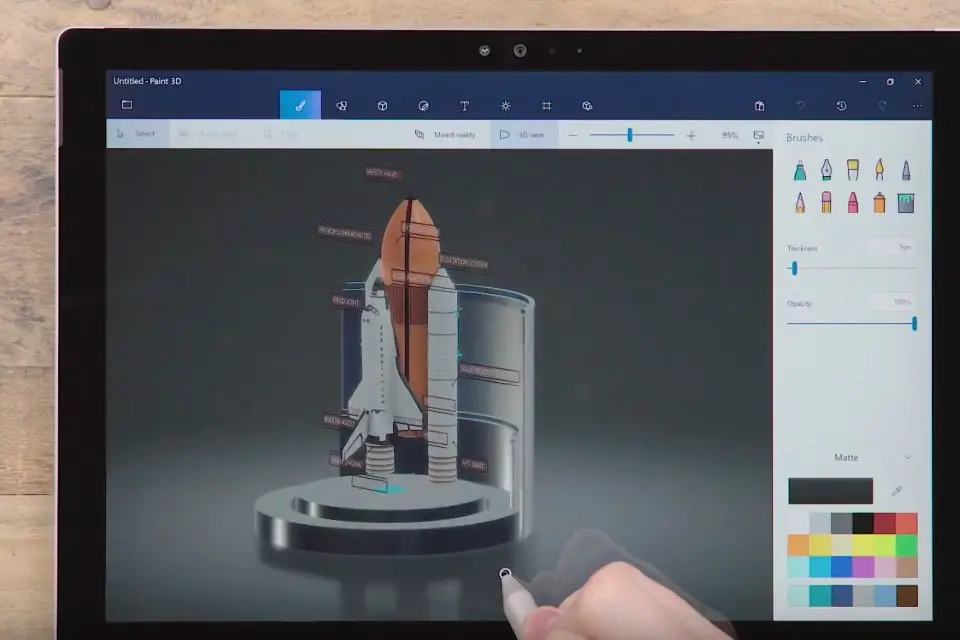
Microsoft Paint 3D is a simple, free software for Windows users that is suitable for making basic edits and creating straightforward visuals. It’s not as feature-rich as other alternatives on this list, but its ease of use and accessibility make it a solid choice for simple tasks.
#5. Inkscape
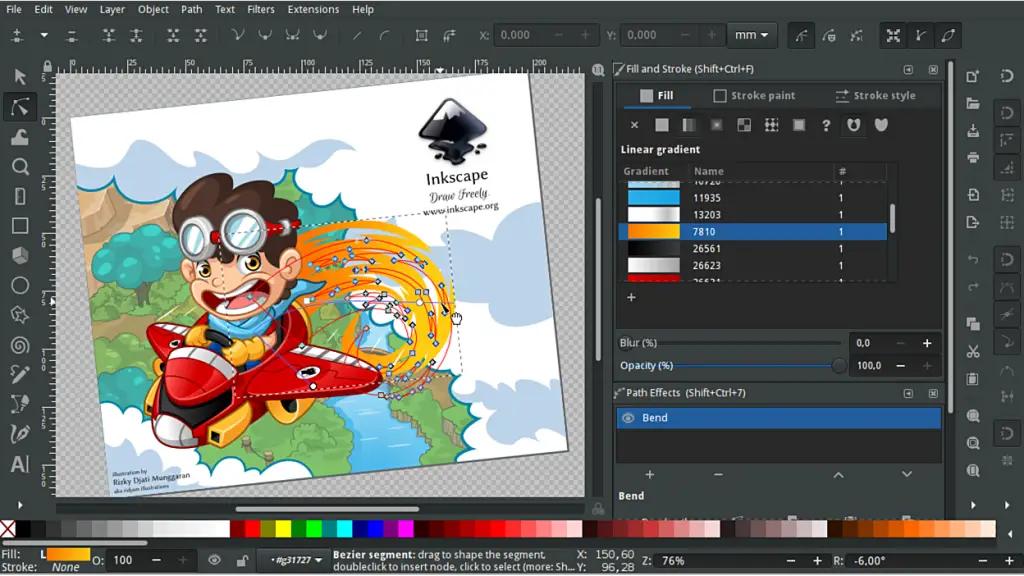
Inkscape is a free and open-source vector graphics editor that is excellent for creating diagrams and scalable visuals. It’s more suited for technical drawings than image editing, but it’s a great tool for researchers who need to create detailed diagrams for their work.
#6. Tableau
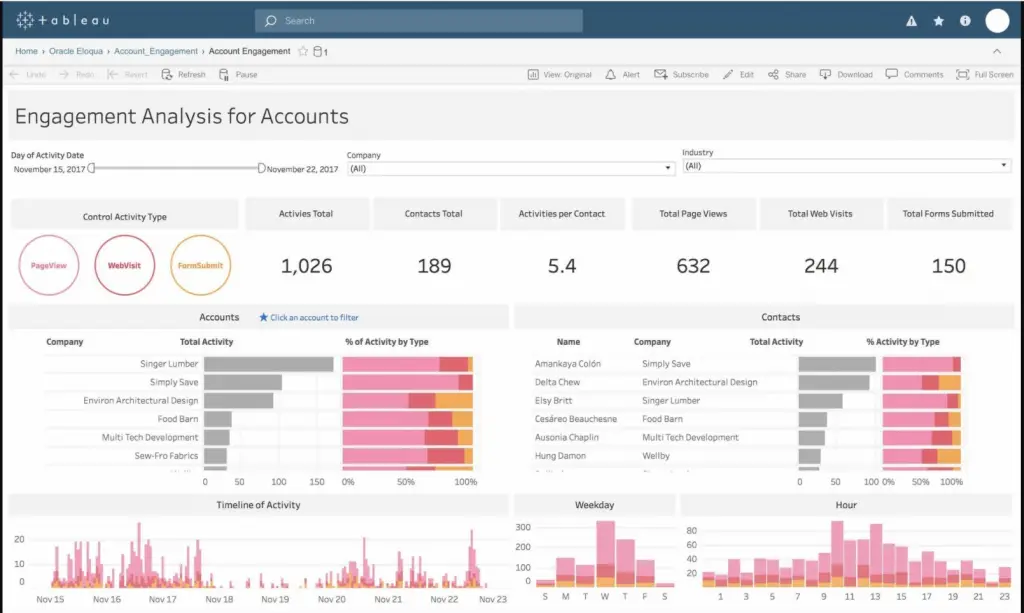
Tableau is not your typical image editing software. It’s a powerful tool designed specifically for creating dynamic, interactive data visualizations.
If your research involves large datasets and you want to represent your data visually in an engaging and interactive way, Tableau is definitely worth considering.
#7. Piktochart
Piktochart is an easy-to-use tool that enables you to create infographics, reports, and presentations using a simple drag-and-drop interface.
It provides various templates, making it a breeze to produce professional-looking visuals. While it does offer a free version, some features and templates are reserved for the paid version.
Each of these tools has its strengths and weaknesses, so the best one for you will depend on your specific needs and budget.
Here is our detailed review of the best free graph drawing software for researchers and students.
VIII. What Are the Downsides to Using Photopea?
As with any tool, Photopea isn’t without its downsides. While it’s a fantastic resource, it has a few limitations to be aware of:
1. Performance Limitations
As a web-based tool, Photopea’s performance is heavily dependent on your Internet connection speed and the capabilities of your web browser. This could mean slower response times or occasional lag, particularly when working with large, high-resolution images or intricate designs.
For those who often find themselves without a strong or stable internet connection, this can prove to be a significant hurdle.
2. Confronting the Learning Curve
Photopea’s interface, while less complex than Adobe Photoshop or Illustrator, does still require some getting used to. For users new to graphic editing, the array of tools, layers, and settings can seem overwhelming.
Unlike paid software that often come with in-depth tutorials and customer support, getting the hang of Photopea may require a more trial-and-error approach or hunting down third-party guides and tutorials online.
3. Navigating the Ads
One of the reasons that Photopea can offer such robust functionality for free is because it is ad-supported. Consequently, users of the free version will have to navigate around ads, which can disrupt the design process and clutter the workspace.
While these can be removed by opting for a premium subscription, this would entail a monthly cost, which may not be viable for everyone. Nonetheless, many users find that the capabilities offered by the free version far outweigh the inconvenience posed by the ads.
4. Feature Accessibility
Another minor gripe some users have with Photopea is the lack of certain features found in more sophisticated software. Although it supports a wide variety of tools and functions, it may not cater to extremely specialized or advanced design needs.
For the majority of users, especially those in academia who are mainly using the tool for straightforward visualization tasks, this is not a problem. However, professional designers or those who require more specific tools might find it limiting.
5. Customer Support
Being a free tool, Photopea doesn’t offer the same level of customer support that you’d find with a paid software suite. While there is a comprehensive online forum where users can seek help and advice, direct support from Photopea can be lacking.
This means that if you run into a unique problem or a bug, you might have to rely on other users for a solution, or wait for the developers to release a fix.
Despite these downsides, it’s important to remember that Photopea is a free tool that offers an impressive array of capabilities that can match, and even exceed, those of some paid software. Its limitations are minor when considering the value it brings, especially to the academic community.
Conclusion
Photopea offers a significant potential for enhancing research visuals, making it a must-have tool for researchers and academicians. Its array of features combined with its accessibility makes it a solid choice for those needing an affordable, robust image editing tool.
Whether you’re preparing visuals for a presentation, an academic paper, or an infographic, Photopea can help transform your data into an engaging and comprehensible format.
Despite some minor downsides, the benefits and capabilities of this tool far outweigh its limitations, making it a highly recommended tool.
Frequently Asked Questions
Here, we answer some common questions about Photopea:
Q1. Is Photopea Safe to Use?
Absolutely, Photopea is safe to use. It’s designed with a user’s security and privacy in mind. The tool operates on your web browser and all the image processing is done locally on your own machine, not on a remote server.
This means that your files are not automatically uploaded or stored online unless you specifically choose to save them to Photopea’s servers. In terms of data privacy and control, this makes Photopea a reliable option.
Q2. How to Deal With Slow Performance on Photopea?
If you’re experiencing slow performance with Photopea, it’s usually related to either your internet connection or your computer’s processing power.
Since Photopea is a browser-based tool, having a stable and strong internet connection is essential. However, if your connection is fine, the issue may be due to your computer’s resources being over-utilized.
Closing unnecessary tabs, applications or programs running in the background can free up system resources and improve performance. If the problem persists, consider clearing your browser’s cache or switching to a different browser entirely.
Q3. What to Do When I Can’t Open a File in Photopea?
If you can’t open a file in Photopea, ensure the file is in a format supported by the software. Photopea is compatible with a wide range of file formats, including PSD, XCF, Sketch, XD, PDF, and more.
If the file is in a supported format and it still won’t open, the file may be corrupted or too large. In such cases, try opening the file with another program to verify if it’s the file or Photopea causing the problem.
Q5. Does Photopea Have Customer Support for Troubleshooting?
Yes, Photopea does provide customer support for troubleshooting, but keep in mind that as a free tool, the response might not be as immediate as with paid software. You can reach out to them via their email for any technical issues you’re facing.
Additionally, Photopea has an active online community, including a subreddit where users share tips, solutions, and tutorials. The Photopea website also hosts a blog with helpful articles and guides that can assist with troubleshooting and learning how to use the tool more effectively.
References
[ 1] https://www.photopea.com/
[ 2] https://workspace.google.com/marketplace/app/photopea/463342976776