Wondering how to make smarter choices with data? Compare the top 25 statistical analysis software in our latest blog post.
Are you tired of struggling to find the perfect statistical analysis software that caters to your unique needs? We’ve been there too, and we’ve got your back.
In this post, we’ll explore the top statistical analysis software available, ensuring you find the ideal solution for your data-driven journey. Say goodbye to frustration and hello to efficiency.
Table of Contents
Overview
Statistical analysis software are tools designed to simplify and automate the process of analyzing data, making it easier for users to draw conclusions and make informed decisions.
These statistical analysis tools are used in various fields, including academia, business, and research, to analyze large datasets and uncover patterns, trends, and relationships within the data.
Choosing the right statistical analysis software depends on several factors, such as the user’s skill level, the specific features required, and the budget available. Let’s take a look at the 25 best statistical analysis software solutions.
Best Statistical Analysis Software
#1. SPSS: Best for Social science research & statistical analysis
Summary
- Comprehensive statistical analysis software
- Used for research across various fields
- Offers a user-friendly interface and versatile functionality
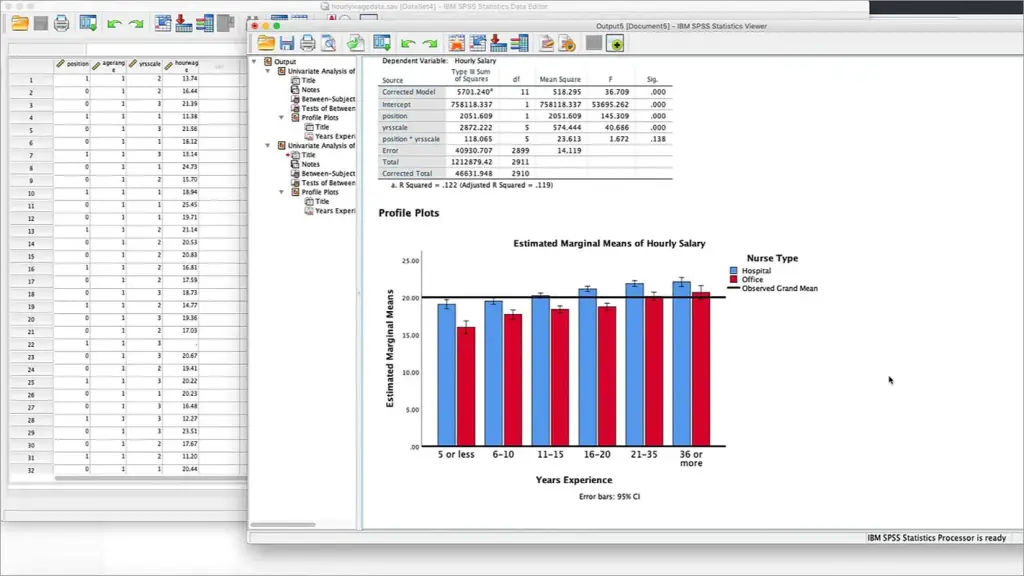
SPSS (Statistical Package for the Social Sciences) is a widely used software suite designed for advanced statistical analysis in research, academia, and data-driven industries.
Both beginners and advanced users can utilize this tool for data management, visualization, reporting, and analysis.
What are the benefits of using SPSS?
- User-friendly Interface: SPSS’s intuitive interface makes it easy for users of all skill levels to navigate and perform complex statistical analyses.
- Comprehensive Functionality: This software offers a wide range of statistical tests and data management features.
- Efficient Data Handling: SPSS’s robust data management capabilities enable users to work with large datasets and streamline their data processing tasks.
- Customizability: The ability to write custom scripts and integrate with other programming languages allows users to adapt SPSS to their unique needs and preferences.
- Reliability: SPSS has been a trusted tool in the research and data analysis community for decades, ensuring users can rely on its accuracy and consistency.
SPSS is a versatile tool for data analysis, offering a comprehensive suite of statistical tests and data management features that cater to both beginners and advanced users in various fields.
Source: https://www.ibm.com
#2. Minitab: Best for data analysis & process improvement
Summary
- Powerful statistical software package
- Used for data analysis, regression, and quality improvement
- Provides extensive tools and educational resources
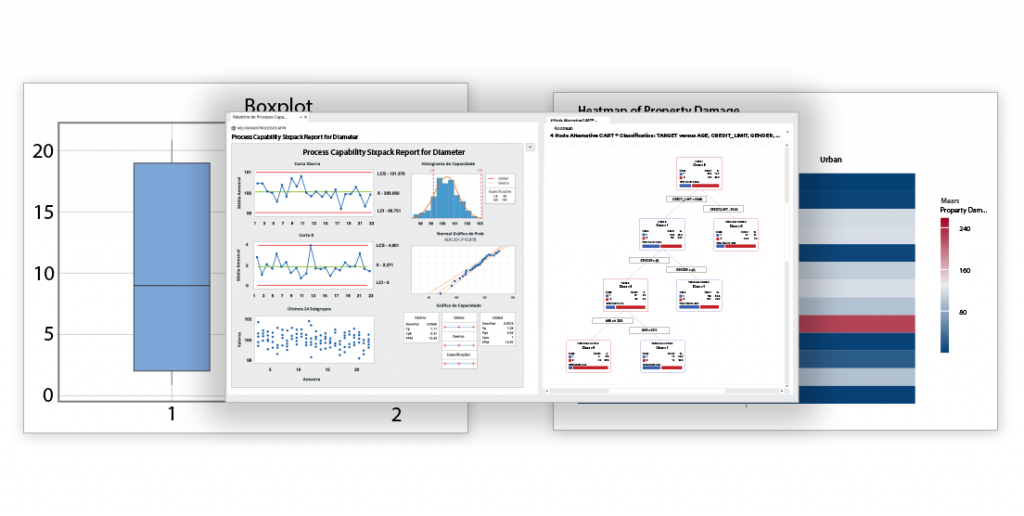
Minitab is a powerful statistical software package specifically designed to assist both professionals and students in analyzing data and deriving meaningful solutions to various research problems.
Here are some of the uses of this tool:
- Data analysis
- Regression analysis
- Hypothesis testing
- Quality improvement
- Forecasting
- Statistical process control (SPC)
What the benefits of using Minitab?
- Comprehensive toolset: Minitab offers a wide range of statistical tools and techniques, enabling users to tackle a variety of research problems.
- Integration with other software: You can seamlessly integrate Minitab with other software packages, such as Microsoft Excel, for increased efficiency.
- Educational resources: Minitab provides extensive support and resources for users, including tutorials, webinars, and a dedicated support team, ensuring that users can make the most of the software.
Minitab is a powerful statistical software package that offers a suite of tools for data analysis, regression, hypothesis testing, quality improvement, forecasting, design of experiments, and statistical process control.
Source: https://www.minitab.com
#3. Stata: Best for econometrics & panel data analysis
Summary
- Robust data management and analysis software
- Used for in-depth statistical analysis and data visualization
- Features a user-friendly design and cross-platform compatibility
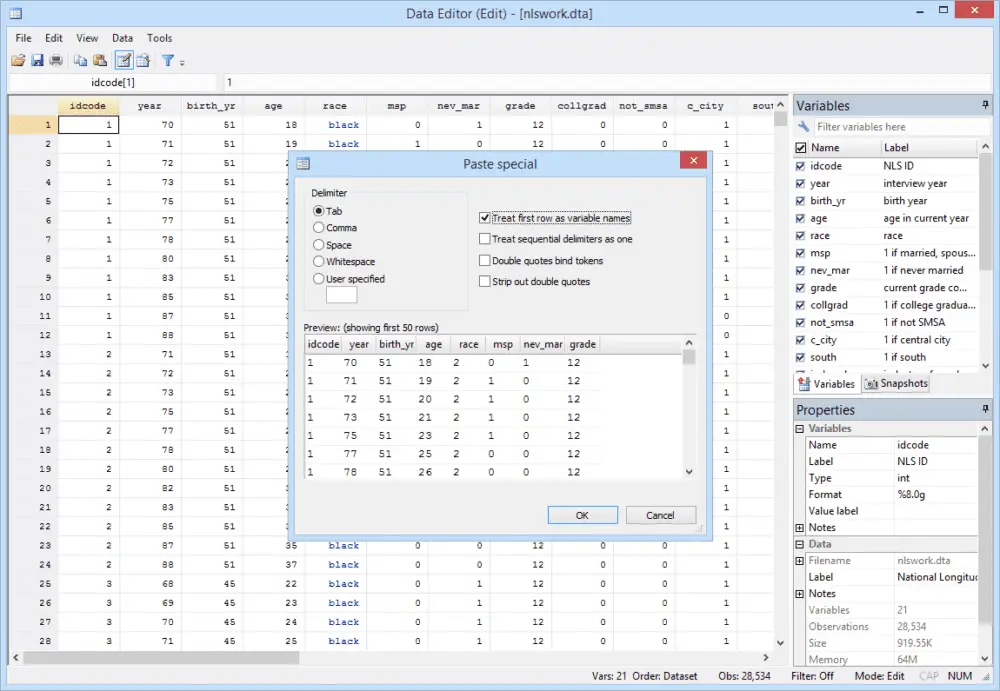
Stata is a robust statistical software widely utilized by professionals across various fields for efficient data management, in-depth statistical analysis, and comprehensive data visualization.
You can also use Stata for:
- Programming
- Reproducible research
What are the benefits of using Stata?
- User-friendly: Stata offers both a command-line interface and a graphical user interface, catering to users with varying levels of experience.
- Regular updates: Stata developers continually update the software, ensuring that users have access to the latest statistical methods and features.
- Cross-platform compatibility: Stata is available for Windows, macOS, and Linux, making it accessible to users on different operating systems.
Stata is one of the best tools for statistical analysis. Its comprehensive suite of tools has made it a reliable and efficient tool for professionals and students alike.
Source: https://www.stata.com/
#4. JMP: Best for data visualization & exploratory data analysis
Summary
- Data exploration and visualization software
- Used for predictive modeling, Design of Experiments, and quality improvement
- Delivers dynamic visualizations and collaboration features
JMP is a comprehensive statistical software suite specifically designed to facilitate data exploration, visualization, and analysis for researchers and students across diverse fields.
Other uses of this tool include:
- Predictive Modeling
- Design of Experiments (DOE)
- Quality and Process Improvement
What are the benefits of using JMP?
- Dynamic Data Visualization: JMP’s dynamic visualizations enable users to interact with their data in real-time, allowing for deeper exploration and understanding.
- Customizable Analysis: This tool allows users to tailor their analyses to their unique needs.
- Collaboration and Sharing: JMP provides options for sharing results and visualizations with colleagues.
JMP is a top-rated tool for data exploration and analysis, delivering dynamic data visualization and an extensive selection of statistical tools to empower users to make well-informed decisions based on their findings.
Source: https://www.jmp.com
#5. MATLAB: Best for engineering & computational mathematics
Summary
- High-level programming language and interactive environment
- Used for numerical computing, data analysis, and algorithm development
- Includes extensive libraries and research capabilities
MATLAB, short for Matrix Laboratory, offers students and professionals a high-level programming language and interactive computing environment designed for numerical computing, data analysis, and visualization.
Other uses of MATLAB include:
- Algorithm development
- Modeling and simulation
- Scientific research
What are the benefits of using MATLAB?
- Extensive libraries: MATLAB offers a vast selection of built-in functions and toolboxes, covering various domains like image processing, machine learning, and optimization.
- Cross-platform compatibility: MATLAB works on multiple platforms, including Windows, macOS, and Linux, allowing for seamless collaboration and sharing of code.
- Interoperability: MATLAB can interface with other programming languages, such as C, C++, Java, and Python, allowing users to incorporate existing code or leverage specialized libraries.
MATLAB is an exceptional choice for individuals seeking to perform advanced statistical analysis and data visualization. Its high-level programming environment and comprehensive range of tools enable users to efficiently process, analyze, and visualize their data.
Source: https://www.mathworks.com
#6. Tableau: Best for data visualization & business intelligence
Summary
- Versatile data visualization software
- Used for data exploration, analysis, and reporting
- Supports an easy-to-use interface and collaboration options
Tableau is a robust data visualization software that enables researchers, students, and professionals to transform unprocessed data into valuable insights.
You can use this tool for:
- Data exploration and analysis
- Generating reports and presentations
- Collaborative decision-making
- Trend identification and forecasting
- Geospatial data visualization
- Real-time data monitoring
- Statistical analysis
What are the benefits of using Tableau?
- Easy-to-use interface: Tableau’s interface is designed for users with varying levels of expertise, making it accessible to beginners and advanced users alike.
- Speed and performance: Tableau is known for its fast processing and rendering of large datasets, enabling users to quickly analyze and visualize their data.
- Integration with various data sources: Tableau can connect to a variety of data sources, including databases, spreadsheets, cloud-based applications, and more.
- Collaboration features: Tableau allows users to share their visualizations and collaborate with others, making it an excellent tool for team-based projects.
- Scalability: Tableau is suitable for both small-scale projects and large-scale enterprise deployments, making it a versatile solution for organizations of all sizes.
Tableau is a top tool for data visualization that offers an easy-to-use interface and a comprehensive range of customization options. These features enable users to create compelling visualizations of their data.
Source: https://www.tableau.com
#7. Base SAS: Best for data management & advanced analytics
Summary
- Comprehensive statistical software suite
- Used for data analysis, reporting, predictive modeling, and automation
- Offers comprehensive functionality, scalability, extensibility, and reliability
This statistical software suite helps researchers and professionals with their data management, analysis, and reporting purposes tasks.
Other uses for this tool include:
- Predictive modeling: Users can build and validate predictive models using advanced statistical algorithms available in Base SAS.
- Automation: Base SAS can help you to automate repetitive tasks, streamlining data processing and analysis workflows.
What are the benefits of using Base SAS?
- Comprehensive functionality: Base SAS offers a complete suite of tools for data management, analysis, and reporting, catering to various user needs.
- Extensibility: The software can be easily integrated with other SAS products or third-party tools, allowing users to expand their analytical capabilities.
- Reliability: Base SAS is known for its robustness and accuracy, making it a trusted choice for professionals and researchers worldwide.
Base SAS is an invaluable tool for data analysis. Its powerful capabilities enable users to make informed decisions based on their findings. This contributes to better research outcomes and data-driven decision-making processes.
Source: https://www.sas.com
#8. XLSTAT: Best for data mining & multivariate analysis
Summary
- Versatile statistical add-on for Microsoft Excel
- Used for data visualization, regression analysis, and data mining
- Provides seamless integration, time-saving features, reliable results, and regular updates
XLSTAT is a versatile statistical software add-on for Microsoft Excel that enables researchers to analyze data and make well-informed decisions.
You can use XLSTAT for:
- Data visualization
- Descriptive statistics
- Regression analysis
- Data mining
What are the benefits of using XLSTAT?
- Seamless integration: XLSTAT works directly within Microsoft Excel, allowing you to leverage your existing knowledge of the software.
- Time-saving: Automate repetitive tasks and streamline your data analysis process.
- Reliable results: Trust in the accuracy and validity of your findings, as XLSTAT adheres to strict statistical standards.
- Regular updates: Stay up-to-date with the latest statistical methods and improvements through frequent software updates.
XLSTAT as a comprehensive software add-on, offers a wide array of tools and techniques to help you make sense of your data.
Source: https://www.xlstat.com
#9. Origin: Best for graphing & data analysis
Summary
- Data visualization and analysis software
- Used by researchers and professionals for data analysis, graph creation, and statistical testing
- Provides advanced tools, thorough documentation, easy integration, and a strong user community
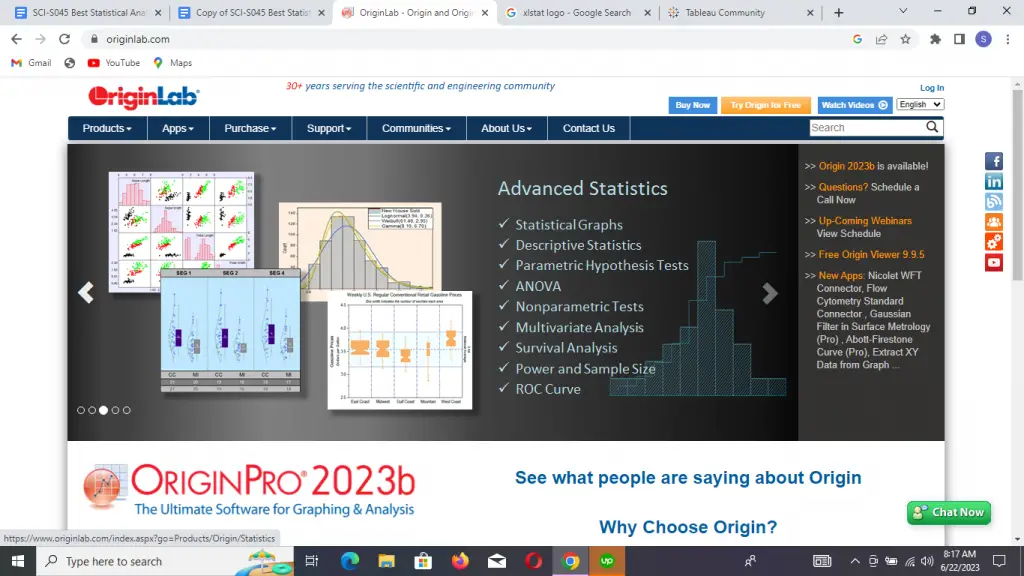
Academicians and professionals use OriginPro for the purpose of data visualization, statistical analysis, and curve fitting.
This powerful tool offers a wide range of customizable graphs and a plethora of statistical tools to assist users in making well-informed decisions based on their findings.
What are the benefits of using Origin?
- Advanced statistical tools: Origin offers a vast array of statistical tools, including descriptive statistics, hypothesis testing, and regression analysis.
- Comprehensive documentation: Origin provides extensive documentation and tutorials, making it accessible for both beginners and experienced users.
- Integration with other software: This tool can easily import and export data from various file formats and can be integrated with other software, such as Microsoft Excel and MATLAB.
- Active user community: Origin has a large and active user community, providing a valuable resource for troubleshooting and learning new techniques.
With its user-friendly interface, comprehensive documentation, and active user community, Origin is an invaluable resource for researchers, scientists, and students alike.
Source: https://www.originlab.com
#10. GraphPad Prism:. Best for graphing & statistical analysis
Summary
- Statistical software package tailored for scientific research
- Used for statistical analysis, nonlinear regression, graphing, and data visualization
- Offers comprehensive analysis tools, high-quality graphs, and customizable output
GraphPad Prism is a powerful statistical software package specifically tailored for scientific research purposes. This is an excellent choice for those seeking to perform statistical analysis, nonlinear regression, graphing, and data visualization with ease.
What are the benefits of using GraphPad Prism?
- Comprehensive analysis tools: Access a wide range of statistical tests and models to suit various research needs.
- High-quality graphs: Produce publication-ready graphs and charts that effectively communicate results.
- Customizable output: Tailor data presentation to match specific requirements and preferences.
GraphPad Prism stands out as an exceptional choice for researchers and students seeking to perform statistical analysis and data visualization within an accessible and intuitive environment.
Source: https://www.graphpad.com
#11. QLik Sense: Best for data visualization & business intelligence
Summary
- Offers a visual analytics platform
- Used by researchers and professionals for insights and decision-making
- Offers user-friendly interface, versatile visualizations, efficient data preparation, and robust security
QLik Sense is a data analytics and visualization Windows application designed to assist researchers, students, and professionals in transforming complex raw data into valuable insights.
What are the benefits of using QLik Sense?
- Ease of use: QLik Sense’s drag-and-drop interface makes it easy for users with varying levels of expertise to create and customize visualizations.
- Flexibility: The platform offers a wide range of visualization options, allowing users to tailor their analysis to their specific needs.
- Smart data preparation: The platform’s intelligent data preparation features help users clean and transform data more efficiently.
- Secure and reliable: QLik Sense offers robust security features and a reliable infrastructure, ensuring that your data is protected and accessible when needed.
QLik Sense is an innovative tool for data analytics and visualization, designed to meet the needs of users from various backgrounds and industries.
Source: https://www.qlik.com
#12. TiMi Suite: Best for data mining & predictive analytics
Summary
- Comprehensive data analysis platform
- Has 4 tools for data mining, predictive analytics, and reporting
- Provides customization and collaboration features
TiMi Suite is an all-inclusive collection of analytical tools specifically crafted for data mining, predictive analytics, and reporting purposes. These tools cater to the needs of professionals across a wide range of domains.
What are the benefits of using TiMi Suite?
- Comprehensive Toolset: TiMi Suite offers a diverse set of tools, covering various aspects of data analysis, allowing users to address a wide range of analytical needs.
- Customization: TiMi Suite allows users to tailor the tools to their specific needs, ensuring that the platform remains flexible and adaptable to changing requirements.
- Collaboration: TiMi Suite’s collaborative features enable users to work together on data analysis projects, fostering teamwork and improving overall efficiency.
TiMi Suite is a valuable data analysis platform, offering an extensive range of data mining, predictive analytics, and reporting tools.
Source: https://timi.eu
#13. Statgraphics: Best for quality control & statistical process control
Summary
- Data analysis and visualization software
- User-friendly interface and extensive statistical tools
- Customizable visualizations and efficient data management
Statgraphics is a versatile data analysis and visualization software widely utilized by researchers in various fields for statistical analysis, data management, and quality improvement purposes.
What are the benefits of using Statgraphics?
- User-friendly interface for both beginners and advanced users
- Comprehensive suite of statistical tests and tools
- Efficient data management capabilities
- High-quality, customizable visualizations
- Regular updates and feature enhancements
Statgraphics is a robust and powerful tool for data analysis, offering an extensive range of statistical tests and data management features that cater to both novice and experienced users.
Source: https://www.statgraphics.com
#14. GNU PSPP: Best for data management & statistical analysis
Summary
- Free, open-source statistical analysis software
- Affordable alternative to SPSS
- User-friendly interface and data security
GNU PSPP is a free, and open-source software for statistical analysis, primarily aimed at researchers and students. It serves as an excellent alternative to the proprietary software, SPSS (Statistical Package for the Social Sciences).
With a wide range of statistical tests and data management features, GNU PSPP is suitable for both beginners and advanced users.
Other uses of this tool include:
- Descriptive statistics
- Inferential statistics
- Data management
- Non-parametric tests
- Reliability analysis
What are the benefits of using GNU PSPP?
- Cost-effective: As a free and open-source software, GNU PSPP is an affordable alternative to expensive statistical packages.
- User-friendly interface: Its interface is similar to SPSS, making it easy for users familiar with SPSS to transition to GNU PSPP.
- Data security: As a locally installed software, users have full control over their data and its privacy.
GNU PSPP is an ideal choice for individuals seeking a free and open-source alternative to SPSS.
Source: https://www.gnu.org
#15. Scilab: Best for scientific research & numerical computations
Summary
- Free, open-source software for numerical computation and data analysis
- Cross-platform compatibility and extensive library of functions
- User-friendly interface for various applications
Scilab is a powerful, free, and open-source software widely used by researchers, students, and professionals in various fields such as engineering, mathematics, physics, and more.
Its uses include:
- Numerical computation
- Data analysis
- Visualization
- Signal processing
- Control system design
- Image processing
What are benefits of using Scilab?
- Free and open-source: Scilab is available at no cost, making it an affordable alternative to commercial software packages.
- Cross-platform: Scilab is compatible with Windows, macOS, and Linux operating systems.
- Extensive library of functions: Scilab offers a wide range of built-in functions and toolboxes for various applications.
- User-friendly interface: Scilab features an intuitive graphical user interface, making it easy to learn and use for both beginners and advanced users.
Scilab is a cost-effective solution for those looking to perform advanced statistical analysis and data visualization.
Source: https://www.scilab.org
#16. Google Data Studio: Best for data visualization & dashboard creation in Google ecosystem
Summary
- Data visualization and reporting platform
- Seamless integration with Google products
- Customizable templates and collaboration features
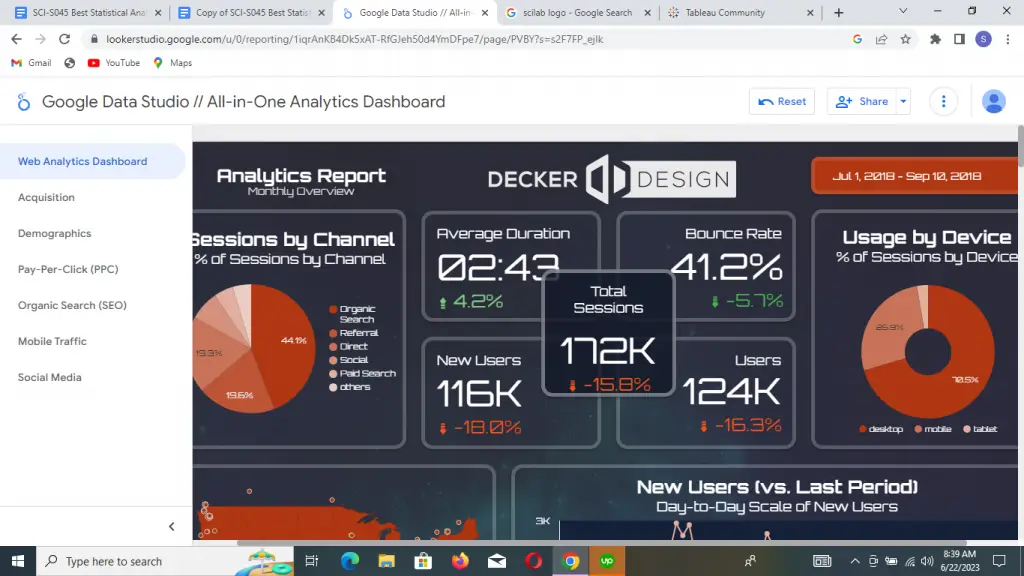
Google Data Studio is a complementary data visualization and reporting platform that aids researchers and professionals in converting raw data into valuable insights.
Uses of this tool include:
- Visualizing data from multiple sources
- Creating interactive dashboards
- Generating custom reports
- Analyzing trends and patterns in data
- Comparing data across different time periods
What are the benefits of using Google Data Studio?
- Integration with Google products: Seamlessly connect with other Google tools, such as Google Analytics, Google Sheets, and Google Ads, to import and visualize data.
- Wide range of data connectors: Access data from various sources, including databases, spreadsheets, and third-party applications.
- Customizable templates: Choose from a variety of pre-built templates or create your own to speed up the report creation process.
- Collaboration features: Share and collaborate on reports and dashboards with team members in real-time.
With its intuitive interface and extensive customization options, Google Data Studio makes it easy for users to create captivating visualizations of their data, regardless of their technical expertise.
Source: https://analytics.google.com
#17. JASP: Best for Bayesian statistics & data analysis
Summary
- Free, open-source statistical software for researchers and students
- Boasts comprehensive statistical tools and R integration
- Offers various export options for results and visualizations
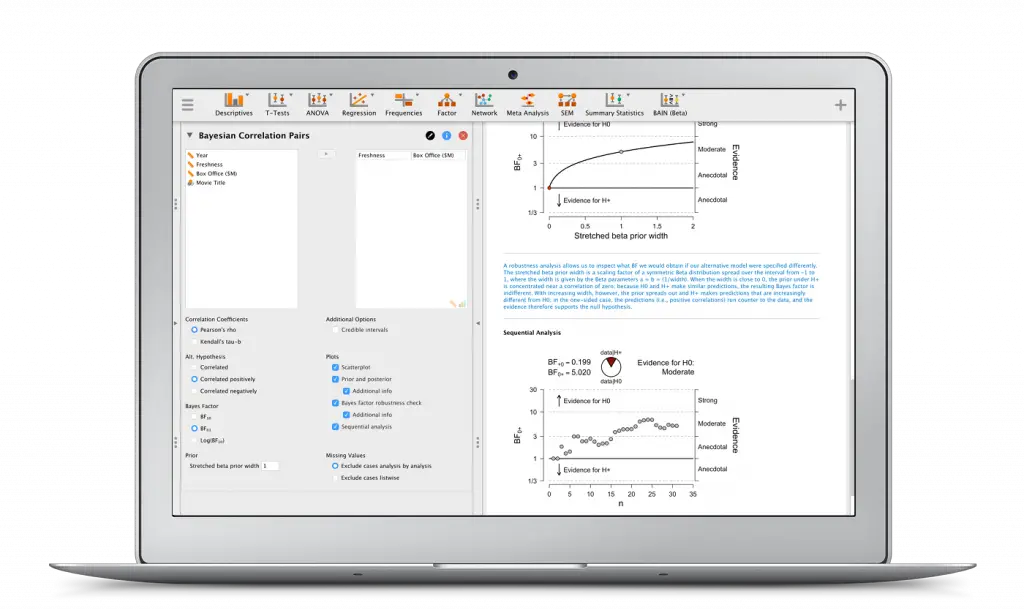
This versatile, free, and open-source statistical software is specifically designed to cater to the needs of researchers and students. With its user-friendly interface, JASP makes data analysis and visualization more accessible and efficient.
You can also use this tool for:
- Hypothesis testing
- Regression analysis
- Bayesian analysis
- Structural equation modeling
What are the benefits of using JASP?
- Comprehensive statistical tools: JASP offers a wide range of statistical tests and methods, accommodating various research needs.
- Integration with R: JASP allows for seamless integration with R, a popular programming language for statistical computing, expanding its capabilities even further.
- Export options: JASP offers various export options, allowing users to save their results and visualizations in multiple formats, such as APA style, CSV, and HTML.
JASP serves as an excellent choice for individuals seeking a user-friendly platform for their statistical analysis needs.
Source: https://jasp-stats.org
#18. EViews: Best for econometric analysis & forecasting
Summary
- Statistical software for econometric analysis and forecasting
- Robust data management capabilities and high-quality graphics
- Customizable programming language and extensive documentation
EViews is a powerful statistical software package designed for conducting econometric analysis, forecasting, and data management tasks.
This tool is popular among researchers, students, and professionals across various fields to analyze data, make forecasts, and manage large datasets.
What are the benefits of using EViews?
- Robust data management capabilities: EViews enables users to easily import, export, and manipulate large datasets.
- High-quality graphics and visualization: EViews offers customizable graphical tools for presenting data and analysis results.
- Extensive documentation and support: EViews provides detailed documentation, tutorials, and user support to help users get the most out of the software.
- Customizable programming language: EViews allows users to create their own programs and routines using its built-in programming language.
With its comprehensive suite of statistical tests and procedures, EViews enables users to make informed decisions based on their findings.
Source: https://www.eviews.com
#19. Posit: Best for survey analysis & social science research
Summary
- User-friendly statistical software for psychology research
- Tailored for specific needs and streamlined data import/export
- Collaborative features for team-based research projects
Posit is a user-friendly statistical software package specifically designed for researchers and students in the field of psychology.
It offers a comprehensive suite of data analysis and visualization capabilities that enable users to make sense of their data and draw meaningful conclusions.
What are the benefits of using Posit?
- Tailored for the specific needs of psychology research
- User-friendly interface for easy navigation and use
- Streamlined data import and export capabilities
- Collaborative features for team-based research projects
- Cost-effective solution for both individual researchers and institutions
Posit stands out as an exceptional choice for individuals and organizations conducting research in psychology, as it provides a broad array of tools and features that cater to the unique needs of this field.
Source: https://posit.co
#20. Gretl: Best for econometrics & time series analysis
Summary
- Free econometric software
- Covers data analysis, forecasting, nonlinear estimation, and discrete choice models
- User-friendly, extensive library, customizable with Hansl scripting
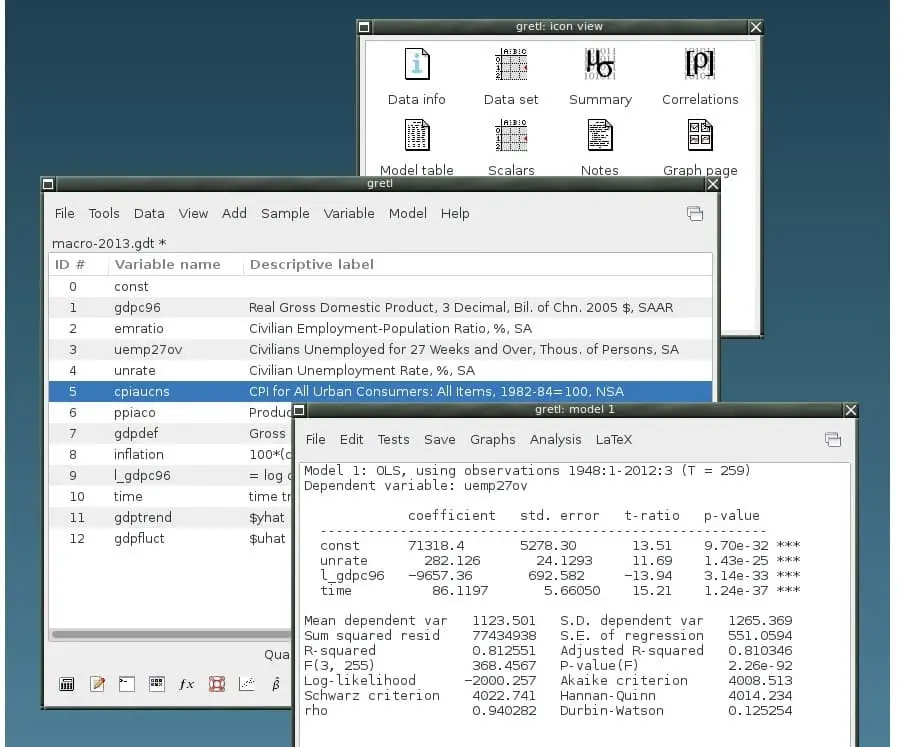
Gretl is also a versatile, free, and open-source statistical software package specifically tailored for econometric analysis. This tool offers an accessible and cost-effective solution for performing advanced statistical analysis.
You can also use this tool for:
- Time series analysis
- Cross-sectional data analysis
- Panel data analysis
- Forecasting
- Nonlinear estimation
What are the benefits of using Gretl?
- Free and open-source: Provides an affordable alternative to expensive statistical software packages.
- User-friendly interface: Features an intuitive graphical interface, making it easy for both beginners and advanced users to navigate and perform analyses.
- Extensive library of statistical tests and models: Offers a wide range of econometric tools and techniques to accommodate various research needs.
- Customization and extensibility: Allows users to write their own functions and procedures using the Gretl scripting language, Hansl.
With its extensive range of statistical tests and data management features, Gretl caters to both beginners and advanced users. The software’s user-friendly interface, customization options, and cross-platform compatibility make it an attractive option for researchers and students in various fields.
Source: https://gretl.sourceforge.net
#21. NCSS: Best for statistical analysis & graphics
Summary
- Versatile data analysis software
- Boasts customizable graphs, high-quality reporting, excellent support
- Suitable for novices and experts
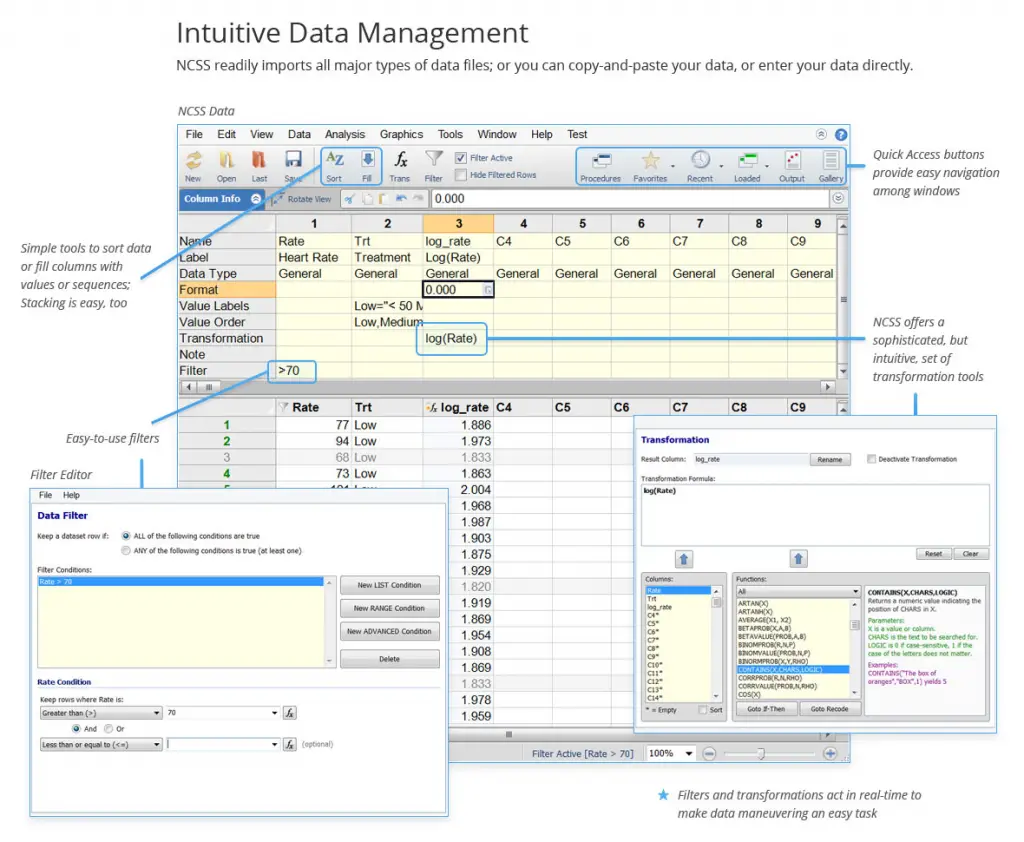
NCSS is a versatile statistical software suite designed for data analysis, visualization, and reporting.
Other uses include:
- Data management
- Teaching and learning
What are the benefits of using NCSS?
- Customizable graphs and charts: NCSS allows users to create visually appealing and informative visualizations to effectively communicate their findings.
- High-quality reporting: The software enables users to generate professional reports, facilitating clear communication of results to colleagues or for publication.
- Excellent support and resources: NCSS provides extensive documentation, tutorials, and customer support, ensuring that users have access to the help and information they need.
NCSS is a robust and user-friendly tool for data analysis, offering an extensive suite of statistical tests and data management capabilities that cater to both novice and experienced users.
Source: https://www.ncss.com
#22. Epi Info: Best for public health research & disease surveillance
Summary
- Free software for public health professionals
- Comprehensive data analysis, management, visualization
- Cost-effective, robust support, continuous improvement
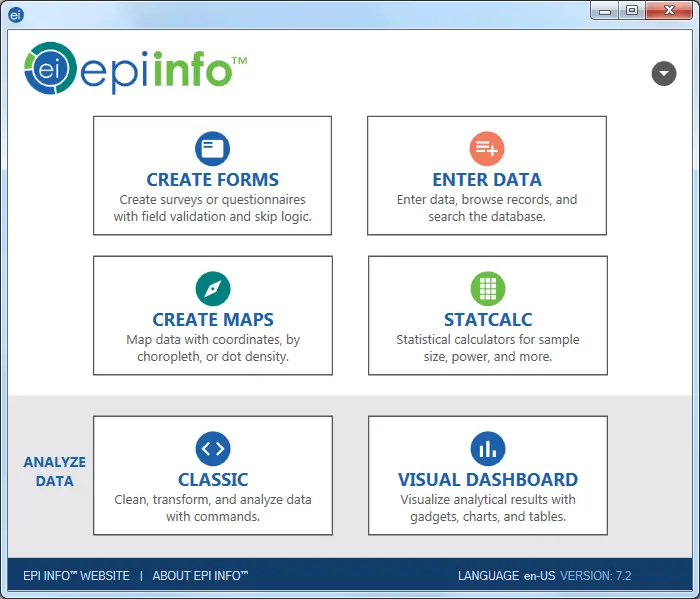
Epi Info is a free, and open-source statistical software package particularly designed to cater to the needs of public health professionals, researchers, and epidemiologists.
This powerful tool offers a comprehensive suite of data analysis, management, and visualization capabilities to assist users in making informed decisions based on their data.
Other uses include:
- Survey Design
- Outbreak Investigation
- Data Sharing
What are the benefits of using Epi Info?
- Cost-effective: As a free and open-source software, Epi Info is accessible to public health professionals and researchers worldwide, without the financial burden of expensive licenses.
- Robust Support: The software is backed by an active community of users and developers, providing a wealth of resources, tutorials, and support forums.
- Continuous Improvement: As an open-source project, Epi Info benefits from regular updates and improvements contributed by its community of developers and users.
Epi Info is an exceptional choice for public health professionals and researchers seeking a comprehensive, user-friendly, and cost-effective statistical software package.
Source: https://www.cdc.gov
#23. RStudio: Best for R programming & statistical modeling
Summary
- R programming IDE
- Supports data analysis, modeling, and visualization, among others
- Features autocompletion, syntax highlighting, debugging, and visualization tools
RStudio is a powerful and user-friendly Integrated Development Environment (IDE) specifically designed for the R programming language.
It enhances the R experience by providing a comprehensive suite of tools and features that streamline the coding process and make it more accessible for users of all skill levels.
Uses of RStudio include:
- Data analysis and manipulation
- Statistical modeling and hypothesis testing
- Data visualization and reporting
- Machine learning and predictive analytics
- Developing and testing custom R packages
- Collaborative coding and version control
- Interactive web applications with Shiny
What are the benefits of using RStudio?
- Code autocompletion and syntax highlighting: RStudio simplifies the coding process by providing autocomplete suggestions and highlighting syntax errors.
- Integrated debugging and error handling: RStudio makes it easy to identify and fix errors with its built-in debugging tools and error messages.
- Comprehensive data visualization tools: RStudio supports a wide range of data visualization packages, enabling users to create stunning and informative graphics.
- Extensive package management: RStudio allows users to easily install, update, and manage R packages directly from the IDE.
RStudio is an excellent choice for anyone looking to perform advanced statistical analysis and data visualization using the R programming language.
Source: https://posit.co
#24. MaxStat: Best for non-statisticians & data analysis
Summary
- Accessible software for researchers and students
- Offers inferential statistics and other data analysis tools
- User-friendly interface, high-quality visualization, and affordable pricing
MaxStat is an accessible statistical software specifically designed to cater to the needs of researchers and students alike.
Uses of MaxStat include:
- Inferential statistics
- Hypothesis testing
- Regression analysis
- ANOVA
- Time series analysis
- Data visualization
- Non-parametric tests
- Power analysis
- Multivariate analysis
What are the benefits of MaxStat?
- User-friendly interface: MaxStat is designed to be easy to use, making it perfect for users with little to no prior experience in statistical software.
- High-quality data visualization: With MaxStat, you can create professional-quality graphs and charts to help you better understand your data.
- Affordable pricing: MaxStat offers a competitive pricing structure, making it an affordable choice for students and researchers on a budget.
MaxStat is an exceptional choice for anyone looking to perform statistical analysis in a user-friendly and accessible environment.
Source: https://www.capterra.com
#25. Domo: Best for Business intelligence & data integration
Summary
- Powerful business intelligence platform for organizations
- Provides real-time data visualization, collaboration, and predictive analytics
- Offers intuitive interface, customizable dashboards, and scalable pricing
Domo is a comprehensive business intelligence platform designed to meet the needs of organizations, from small businesses to large enterprises.
Uses of Domo include:
- Real-time data visualization
- Predictive analytics
- Data integration
- Performance management
- KPI tracking
What are the benefits of using Domo?
- Intuitive interface: Domo offers an easy-to-use interface that allows users to quickly navigate and interact with their data, making it suitable for users with varying levels of technical expertise.
- Customizable dashboards: With Domo, you can create personalized and interactive dashboards tailored to your organization’s specific needs, allowing for better data-driven decision-making.
- Scalable pricing: Domo provides a flexible pricing structure that caters to businesses of all sizes, ensuring that organizations can access its powerful features without breaking the budget.
Domo is an excellent choice for organizations seeking a powerful and user-friendly business intelligence platform to streamline data analysis and improve decision-making processes.
Source: https://www.domo.com
Conclusion
The best statistical analysis software options for you depends on your unique needs, budget, and expertise. By comparing features, ease of use, and community support, you can make an informed decision tailored to your requirements.
Ultimately, investing time in mastering a powerful statistical tool will greatly enhance your data-driven decision-making, empowering you to excel in your research endeavors.

