
Discover the Ultimate Data Analysis Software! Unleash the Power of Research with the Best Data Analysis Software for Research for Maximizing Efficiency!
In today’s data-driven world, researchers often struggle to make sense of vast amounts of information. Manual analysis can be time-consuming and error-prone, hindering progress and valuable insights.
Imagine spending hours poring over spreadsheets, struggling to find patterns or make meaningful conclusions. Frustration mounts as deadlines approach, and the pressure to deliver accurate results intensifies.
But fear not! The solution lies in embracing the best data analysis software for research. These 10 powerful tools empower researchers to efficiently analyze data, unravel hidden patterns, and extract valuable insights with ease.
Say goodbye to tedious manual analysis and unlock the full potential of your research endeavors.
Table of Contents
Top 10 Data Analysis Software for Research: In A Nutshell (2023)
| # | Literature Review Tools | Best For |
| 1. | IBM SPSS Statistics | Comprehensive statistical analysis and data management |
| 2. | SAS | Advanced analytics, data management, and predictive modeling |
| 3. | MATLAB | Numerical computation, data analysis, and algorithm development |
| 4. | Stata | Statistical analysis, data management, and econometrics |
| 5. | Tableau | Data visualization, interactive dashboards, and business intelligence |
| 6. | PowerBI | Creating interactive reports, data visualization, and business analytics |
| 7. | QDA Miner | Qualitative data analysis, content analysis, and text mining |
| 8. | JMP | Statistical analysis, data exploration, and visualization |
| 9. | NVivo | Qualitative research, content analysis, and organizing, coding, and analyzing |
| 10. | MAXQDA | Qualitative and mixed-methods research, data analysis, and text interpretation |
#1. IBM SPSS Statistics – Powerful statistical software platform
IBM SPSS Statistics is a renowned data analysis software widely chosen by researchers for its robustness and versatility. It offers a comprehensive suite of tools for data management, exploratory data analysis, hypothesis testing, and predictive modeling.
Its intuitive interface simplifies the data analysis process, making it efficient and time-saving. With a wide range of statistical techniques, it caters to both basic and advanced research studies.
However, users should be cautious about its resource-intensive nature, requiring powerful computer systems to handle large datasets. Additionally, the software’s licensing cost can be high, posing financial challenges for some researchers.
While IBM SPSS Statistics is generally reliable, occasional compatibility issues with operating systems or other software have been reported. Staying updated with the latest software versions and checking for known issues can help alleviate such problems.
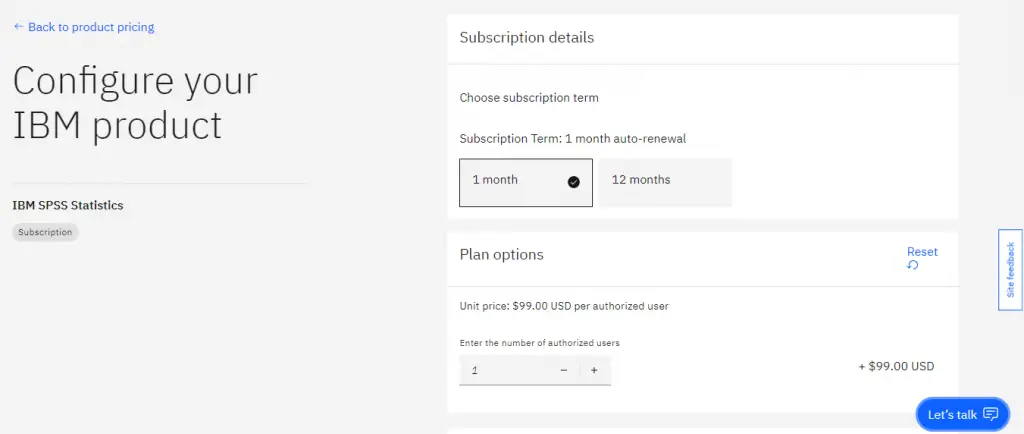
💸Pricing
- IBM SPSS Statistics offer the following pricing plans:
- Monthly: $99
- Yearly: $1069
#2. SAS – Analytics, Artificial Intelligence and Data Management software
SAS (Statistical Analysis System) is a widely-used data analysis software tool favored by researchers across disciplines. Its robustness, reliability, and comprehensive suite of statistical analysis and data management capabilities make it a top choice for professionals in academia and industry.
With advanced data manipulation and integration features, SAS enables users to effectively analyze and interpret complex data sets.
While SAS offers numerous benefits, there are a few considerations to keep in mind. The software has a steep learning curve, requiring some programming knowledge and time to master.
Additionally, SAS can be expensive due to licensing costs, which may pose budget constraints for individual researchers or smaller organizations.
Compatibility limitations with other software tools and data formats, as well as less intuitive and visually appealing graphical capabilities for data visualization, are some known issues with SAS.
Despite these considerations, SAS remains a reliable and versatile tool for researchers, offering a comprehensive set of analytical capabilities to derive meaningful insights from data.
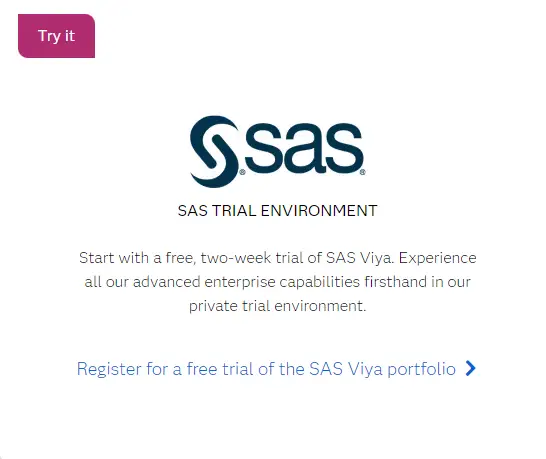
💸Pricing
- Pricing plans of SAS are not publicly available, you need to sign up for a free trial.
#3. MATLAB – High-performance language for technical computing
MATLAB is a highly regarded data analysis software used by researchers in diverse fields. Its popularity stems from its powerful features and user-friendly interface.
With an extensive library of built-in functions and toolboxes, MATLAB enables users to perform complex computations, statistical analysis, and data visualization effortlessly. Its compatibility with various file formats allows seamless integration of data from different sources.
Researchers value MATLAB for its versatility in handling diverse research needs, from exploratory data analysis to machine learning algorithms. The software’s ability to process large datasets swiftly and its interactive programming environment facilitate rapid prototyping and debugging.
However, potential users should be aware of the licensing cost, which may be a limiting factor for those on a tight budget, and the learning curve associated with mastering the syntax and advanced features of MATLAB.
Despite occasional memory limitations and slower performance for certain functions, MATLAB remains an indispensable tool for researchers, offering comprehensive functionality and a vast community of users for support.
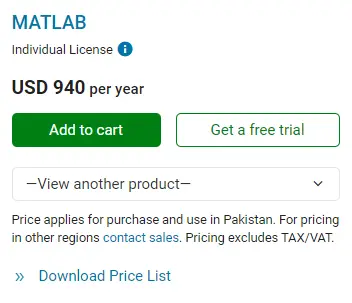
💸Pricing
- The individual License of MATLAB costs $940.
#4. Stata – Statistical software for data science
Stata is a highly regarded data analysis software widely used in research due to its extensive statistical tools and user-friendly interface.
Researchers appreciate Stata’s versatility, as it supports various data formats and offers a comprehensive range of statistical models and techniques for analyzing complex datasets. Its intuitive command syntax and robust documentation make it easier to replicate and share research findings.
However, there are a few aspects to consider when using Stata. It can be quite expensive, particularly for individual users or small research teams with limited budgets.
Additionally, while Stata covers a wide range of statistical capabilities, it may not be the most suitable choice for specialized analyses that require niche software packages.
Some users have also raised concerns about compatibility with other software programs and occasional issues with data handling and memory management.
Nonetheless, Stata remains popular among researchers due to its comprehensive features, user-friendly interface, and strong user community support.
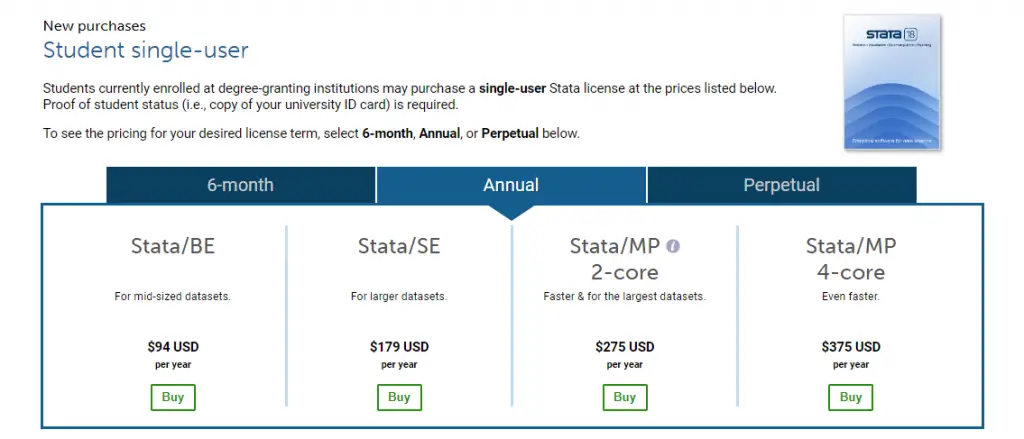
💸Pricing
- Stata offer the following annual pricing plans for students:
- Stata/BE: $94
- Stata/BE: $179
- Stata/MP 2-core: $275
- Stata/MP 4-core: $375
#5. Tableau – Understand your data
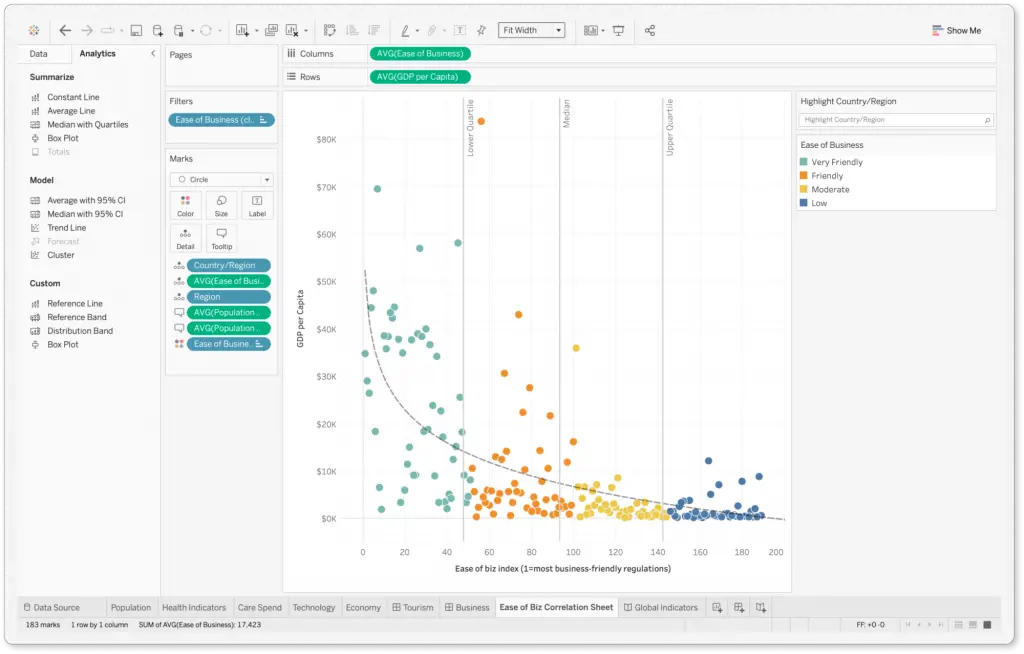
Tableau is a powerful data analysis software that has transformed research with its intuitive interface and comprehensive features. It simplifies complex datasets, allowing researchers to uncover hidden patterns and gain insights.
With its drag-and-drop functionality, Tableau enables users to create visually appealing visualizations without coding skills. It supports various data sources, offers extensive data manipulation options, and facilitates collaboration for team-based research projects.
While Tableau is highly regarded, users should be cautious when working with large datasets as it may impact performance and require significant computational resources. Customization beyond its built-in capabilities can also be challenging.
However, Tableau’s ability to simplify data analysis and present insights in a visually compelling manner makes it a popular choice among researchers.
Continuous updates and a strong community support system ensure that Tableau remains a valuable tool for unlocking the full potential of research data.
💸Pricing
- Tableau offer the following pricing plans:
- Tableau Cloud (Hosted by Tableau) – $70 monthly for every user which is billed annually.
- Tableau Server (On-Premise) – $70 monthly for every user which is billed annually.
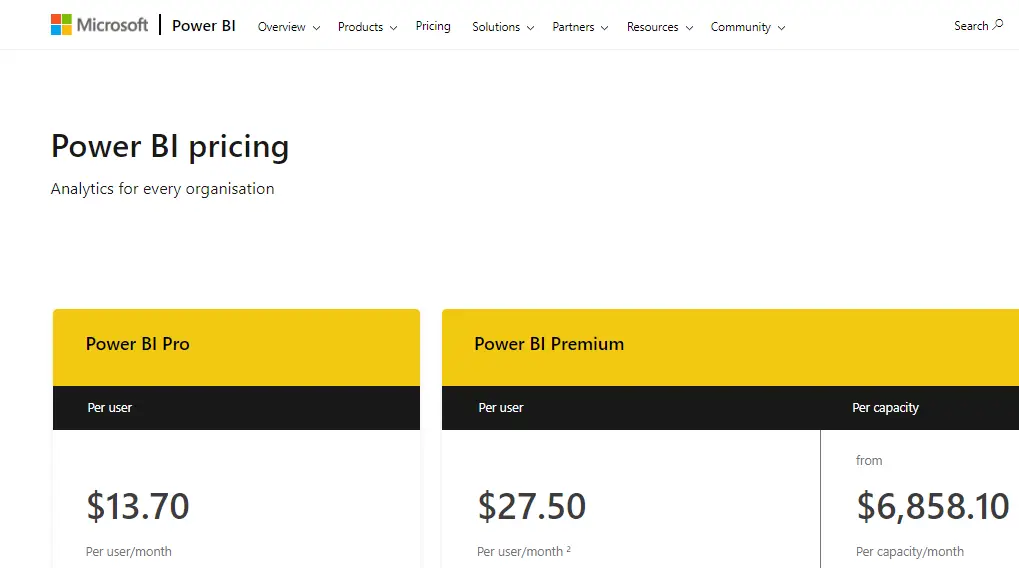
#6. PowerBI – Get the most out of your data
How to use Microsoft Power BI – Tutorial for Beginners
PowerBI is a widely acclaimed data analysis software that has gained popularity among researchers and data enthusiasts. Its user-friendly interface and powerful features make it a top choice for analyzing and visualizing complex datasets.
PowerBI is highly regarded for its ability to handle large amounts of data and generate insightful reports and interactive dashboards.
With seamless integration with various data sources, including databases and spreadsheets, researchers can effortlessly consolidate and transform data into meaningful visualizations and actionable insights.
However, users should be aware of the learning curve associated with PowerBI, especially for individuals new to data analysis. Additionally, while the free version has limited capabilities, the full suite may require a subscription, which can be a consideration for those on a budget.
Despite occasional performance and stability issues, PowerBI remains an invaluable tool for researchers, offering a comprehensive suite of data analysis and visualization features.
💸Pricing
- Power BI offer the following pricing plans:
- Power BI Pro ($13.70 per user/per month)
- Power BI Premium ($27.50 per user/per month)
- Power BI Premium ($6,858.10 per capacity/per month)
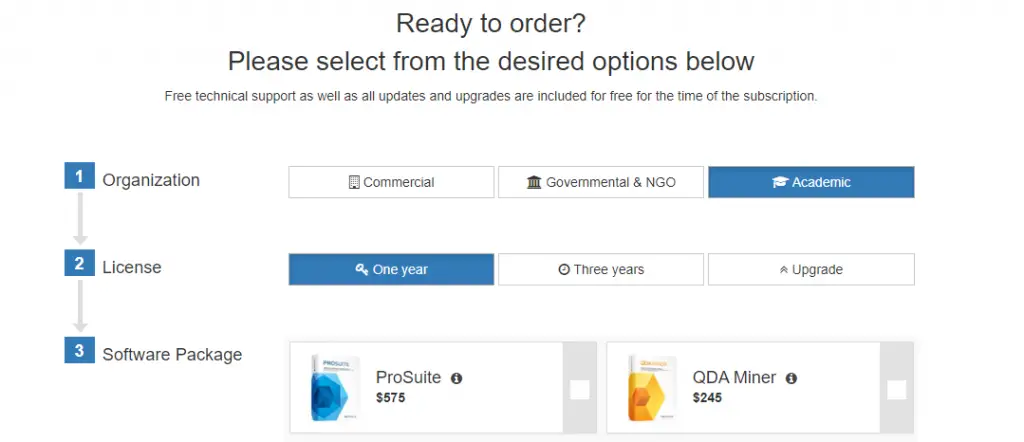
#7. QDA Miner – Qualitative data analysis software
QDA Miner is a popular data analysis software tailored for qualitative research. Its user-friendly interface and powerful features make it a top choice for researchers seeking to analyze and interpret qualitative data.
With the ability to handle diverse data types and a range of tools for coding and analysis, QDA Miner enables users to extract meaningful insights effortlessly.
Customizable coding schemes, complex query capabilities, and visualization options like word clouds and concept maps further enhance the data interpretation process.
However, it’s worth noting that QDA Miner may have a steeper learning curve for inexperienced users. Some occasional glitches and performance issues have also been reported, although they are typically minor and infrequent.
Despite these considerations, QDA Miner remains a reliable and flexible tool for qualitative data analysis, empowering researchers to effectively explore and interpret their data.
💸Pricing
- The pricing details for QDA Miner may vary based on the specific version and licensing options. However, for academic research its cost is $245.
#8. JMP – Visual statistical data analysis software
JMP is a popular data analysis software widely used in research due to its user-friendly interface and robust capabilities. It offers a comprehensive set of tools for exploring and visualizing data, allowing researchers to uncover patterns and make data-driven decisions.
With a focus on exploratory data analysis, JMP enables users to manipulate and visualize data dynamically, making it suitable for a diverse range of research projects.
However, new users may need time to master the advanced features, and occasional performance issues have been reported with large datasets or complex analyses.
Despite these considerations, JMP remains a preferred choice for researchers, thanks to its extensive analysis capabilities, interactive visualizations, and statistical modeling features.
💸Pricing
- Pricing plans for JMP aren’t publicly available, you need to contact their sales team to get a quote.
#9. NVivo – Qualitative research software
NVivo is a leading data analysis software designed specifically for research purposes, particularly qualitative research. With its intuitive interface and extensive range of features, NVivo empowers researchers to efficiently explore, organize, and derive meaningful insights from unstructured data.
It offers powerful coding and categorization tools, enabling users to analyze large volumes of data, identify patterns, and create comprehensive frameworks. The software also provides advanced visualization options for data interpretation and presentation.
However, potential users should be aware of a few considerations. NVivo has a steep learning curve, requiring time and effort to fully grasp its functionalities, especially for beginners.
Careful project planning and adherence to consistent coding conventions are important to avoid complications and inconsistencies in data analysis.
Some users have reported occasional performance issues, particularly with large datasets, so it is recommended to use a well-equipped computer system for optimal performance.
Regular software updates and technical support from NVivo’s team are essential for resolving known issues and maximizing the software’s potential. Despite these considerations, NVivo remains a highly regarded and valuable tool for research data analysis.
💸Pricing
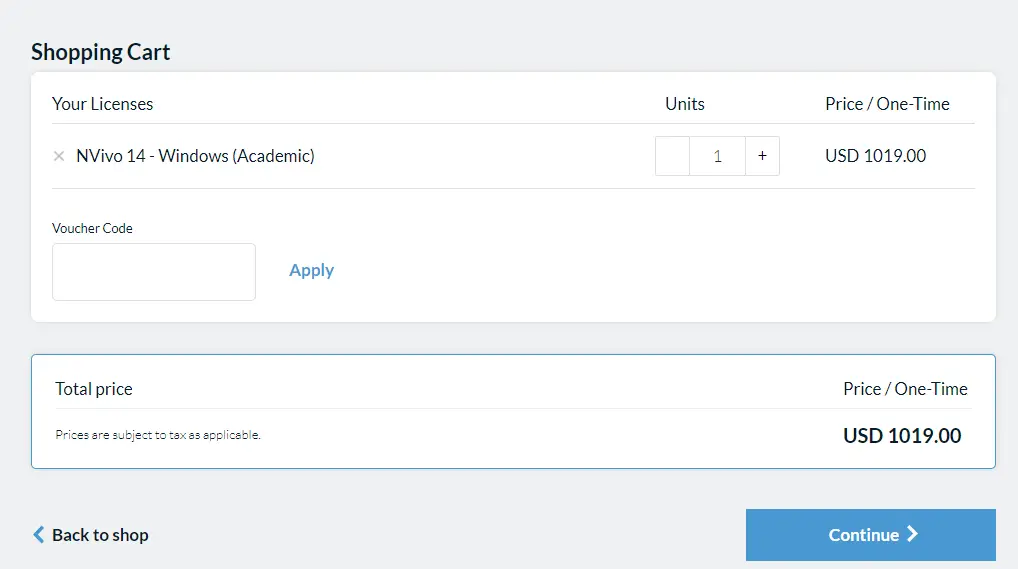
- The cost of the NVivo License is $1,019.
#10. MAXQDA – All-In-One tool for qualitative data analysis
MAXQDA is a widely acclaimed data analysis software used by researchers across various fields. With its user-friendly interface and comprehensive features, it has become a go-to tool for qualitative and mixed-methods research.
MAXQDA offers efficient management, coding, and analysis of diverse data types, including text, images, audio, and video. Its tools, such as word frequency analysis and advanced visualizations, enable researchers to extract valuable insights from their data.
The software’s flexibility and adaptability make it suitable for both beginners and experienced researchers, and its team-based functionalities facilitate collaboration.
However, users should be aware of the learning curve associated with MAXQDA and occasional glitches or slow performance when dealing with large datasets. Overall, MAXQDA empowers researchers to efficiently analyze their data and gain meaningful insights for their research projects.
💸Pricing
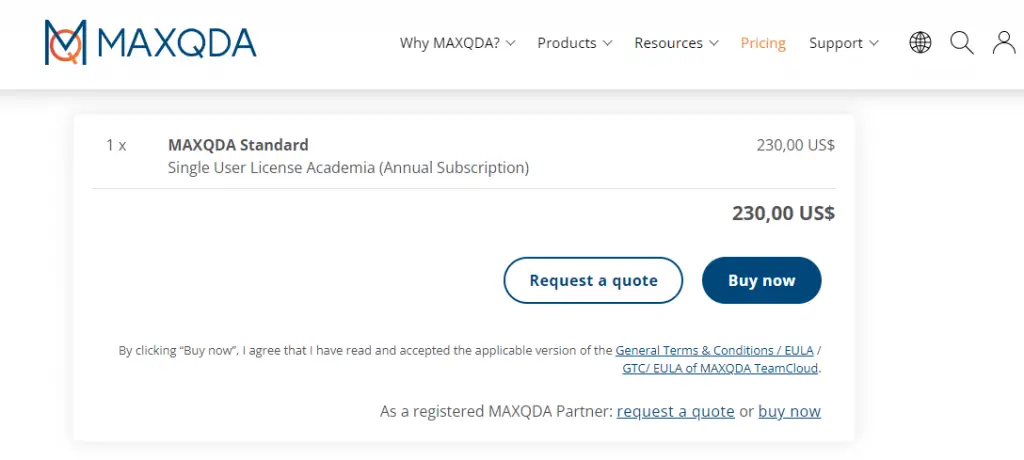
- MAXQDA Single User License Academia Annual Subscription cost is $23,000.
Key Features of Data Analysis Software for Research
Key features of data analysis software for research can vary depending on the specific needs and requirements of the research project. However, here are some key features commonly found in data analysis software that are useful for research:
- Data Import and Integration: The software should allow easy importing and integration of data from various sources, such as spreadsheets, databases, and other file formats. It should support different data types and handle large datasets efficiently.
- Data Cleaning and Preprocessing: The software should provide tools for data cleaning and preprocessing tasks, including handling missing values, removing duplicates, transforming data, and dealing with outliers. These features are crucial for ensuring data quality before analysis.
- Statistical Analysis: The software should offer a wide range of statistical analysis methods, such as descriptive statistics, hypothesis testing, regression analysis, ANOVA, time series analysis, and more. It should provide a comprehensive set of statistical tools to explore and analyze data effectively.
- Data Visualization: The software should include powerful data visualization capabilities, enabling researchers to create charts, graphs, plots, and interactive visualizations to explore and communicate their findings effectively. It should support customization options and provide a variety of visualization types.
- Machine Learning and Predictive Analytics: For more advanced research, the software should incorporate machine learning algorithms and predictive analytics capabilities. This allows researchers to build models, perform classification, clustering, and prediction tasks, and gain insights from complex datasets.
- Reproducibility and Documentation: The software should support reproducibility by allowing researchers to document their analysis steps, code, and workflows. It should provide features for creating reports, annotations, and generating automated documentation, ensuring transparency and facilitating collaboration.
- Data Security and Privacy: Research data often contains sensitive and confidential information. The software should prioritize data security and privacy, providing encryption options, access controls, and compliance with relevant regulations such as GDPR or HIPAA.
- Collaboration and Sharing: The software should facilitate collaboration among researchers, allowing them to share datasets, analyses, and findings with team members. It should support version control, real-time collaboration, and the ability to share results in various formats for easy dissemination.
- Extensibility and Integration: The software should have an extensible architecture, allowing researchers to integrate custom algorithms, scripts, or programming languages. It should provide APIs or scripting interfaces for customization and seamless integration with other tools.
- Support and Documentation: Lastly, the software should have reliable customer support and documentation resources, including tutorials, user guides, forums, and online communities. Regular updates and bug fixes ensure the software remains reliable and up-to-date.
Final Thoughts
In conclusion, when it comes to the best data analysis software for research, there are several excellent options available.
These 10 software tools provide researchers with the necessary features and capabilities to efficiently analyze and interpret complex data sets, enabling them to derive meaningful insights and make informed decisions.
Some of the top contenders in this field include software packages such as R, Python (with libraries like NumPy and pandas), SAS, and SPSS. Each of these tools offers a unique set of advantages, ranging from robust statistical analysis capabilities to extensive data visualization options.
Ultimately, the choice of the best data analysis software depends on the specific research requirements, the user’s level of expertise, and the nature of the data being analyzed.
Researchers should carefully evaluate their needs and consider factors such as ease of use, scalability, community support, and cost before selecting the most suitable software for their research endeavors.
FAQs
Q1. What is the best data analysis software for research?
There is no single “best” data analysis software for research, as it depends on your specific needs and preferences. However, some popular options include R, Python (with libraries such as NumPy and pandas), SAS, SPSS, and MATLAB. These data analytics tools offer a wide range of functionalities and are commonly used by researchers for data analysis.
Q2. What factors should I consider when choosing data analysis software for research?
When selecting data analysis software, consider factors such as the complexity of your data, the statistical techniques you plan to use, your programming skills, the availability of specific features or modules, compatibility with other software or databases, user interface preferences, and the cost of the software.
Q3. Are there any free data analysis software options available for research?
Yes, there are several free and open-source data analysis tools option available. R and Python are popular choices in this category, offering extensive libraries and packages for data manipulation, visualization, and statistical analysis.
Additionally, tools like KNIME, Weka, and Orange provide user-friendly interfaces for data analysis and are free to use.
Q4. Can I use Microsoft Excel for data analysis in research?
While Microsoft Excel is widely used for data analysis, especially in non-academic settings, it may not be the most suitable option for advanced or complex research analyses. Excel has limitations in terms of data size, scalability, reproducibility, and statistical capabilities.
However, for simple analyses and basic calculations, Excel can be a useful data analytics tool.
Q5. Is it necessary to learn programming languages for data analysis software?
Learning programming languages like R or Python can significantly enhance your capabilities as a researcher in data analysis. These languages provide a wide range of libraries and packages specifically designed for statistical analysis, machine learning, and data visualization.
While programming skills are not always mandatory, they can enable more advanced and customizable analyses, automate repetitive tasks, and facilitate reproducible research.